Zip Codes with the Highest Percentage of Population with a Degree in Visual and Performing Arts in Newark, DE
RELATED REPORTS & OPTIONS
Visual and Performing Arts
Newark
Compare Zip Codes
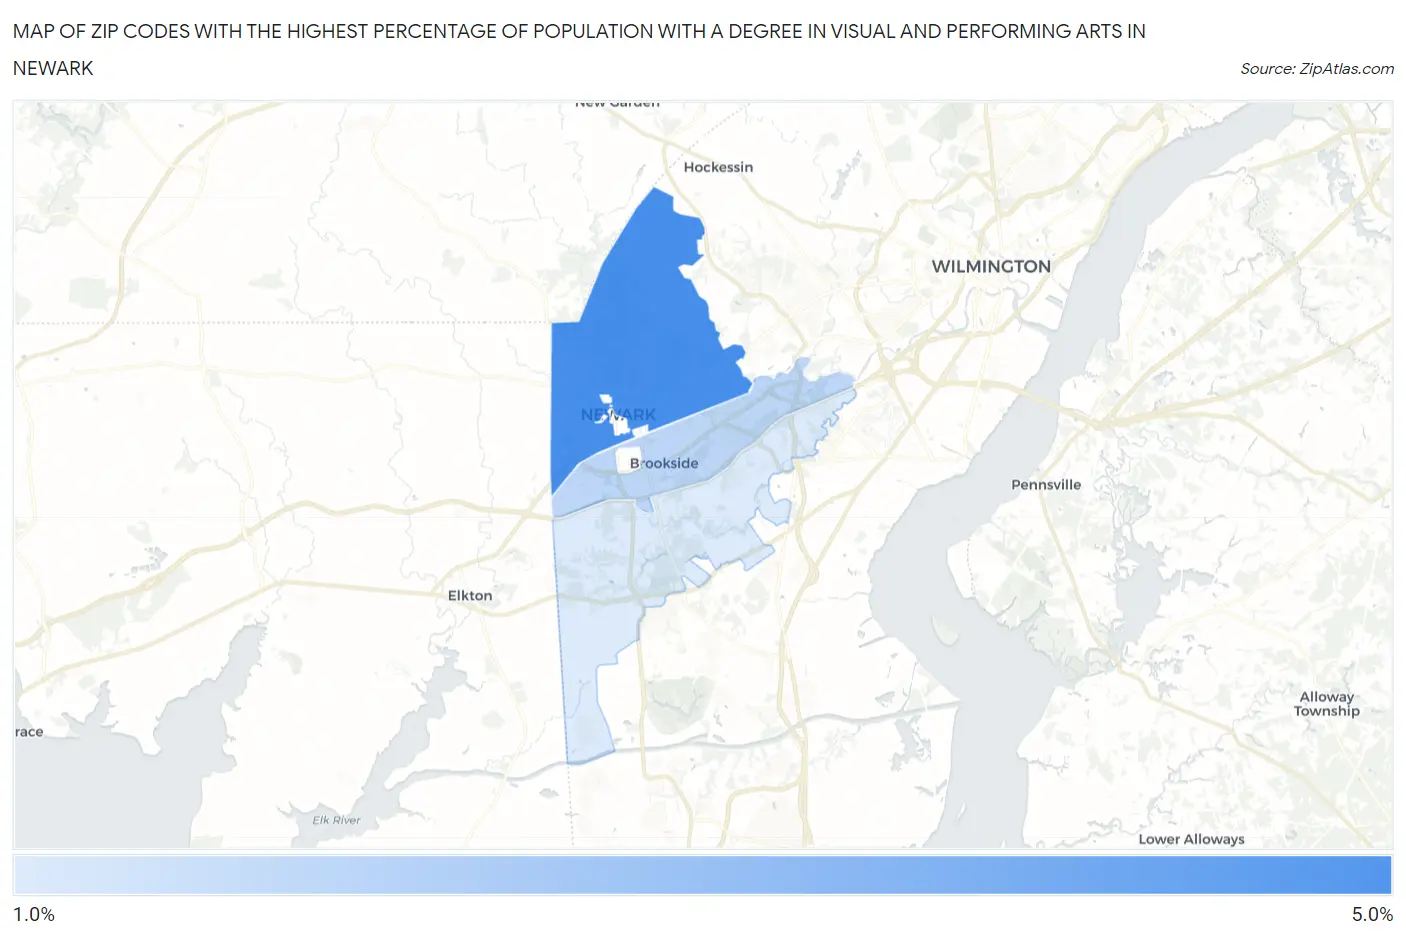
Map of Zip Codes with the Highest Percentage of Population with a Degree in Visual and Performing Arts in Newark
1.0%
4.5%
Zip Codes with the Highest Percentage of Population with a Degree in Visual and Performing Arts in Newark, DE
| Zip Code | % Graduates | vs State | vs National | |
| 1. | 19711 | 4.5% | 2.9%(+1.55)#14 | 4.3%(+0.207)#7,916 |
| 2. | 19713 | 1.7% | 2.9%(-1.16)#45 | 4.3%(-2.51)#17,339 |
| 3. | 19702 | 1.0% | 2.9%(-1.88)#50 | 4.3%(-3.23)#19,601 |
1
Common Questions
What are the Top Zip Codes with the Highest Percentage of Population with a Degree in Visual and Performing Arts in Newark, DE?
Top Zip Codes with the Highest Percentage of Population with a Degree in Visual and Performing Arts in Newark, DE are:
What zip code has the Highest Percentage of Population with a Degree in Visual and Performing Arts in Newark, DE?
19711 has the Highest Percentage of Population with a Degree in Visual and Performing Arts in Newark, DE with 4.5%.
What is the Percentage of Population with a Degree in Visual and Performing Arts in Newark, DE?
Percentage of Population with a Degree in Visual and Performing Arts in Newark is 7.3%.
What is the Percentage of Population with a Degree in Visual and Performing Arts in Delaware?
Percentage of Population with a Degree in Visual and Performing Arts in Delaware is 2.9%.
What is the Percentage of Population with a Degree in Visual and Performing Arts in the United States?
Percentage of Population with a Degree in Visual and Performing Arts in the United States is 4.3%.