Zip Codes with the Highest Percentage of Population Employed in Security & Protection in Newark, DE
RELATED REPORTS & OPTIONS
Security & Protection
Newark
Compare Zip Codes
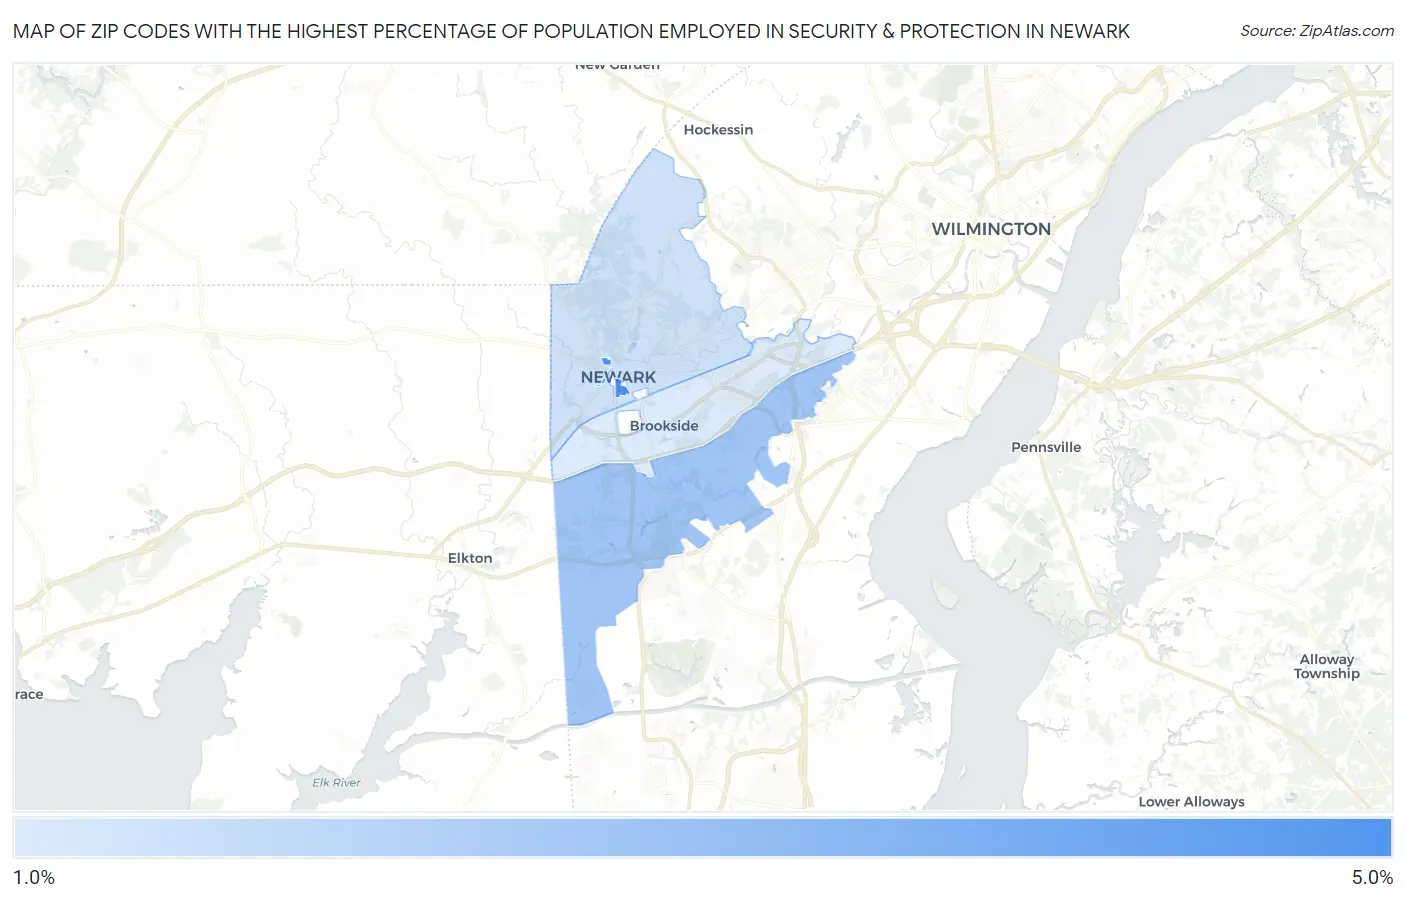
Map of Zip Codes with the Highest Percentage of Population Employed in Security & Protection in Newark
1.8%
4.6%
Zip Codes with the Highest Percentage of Population Employed in Security & Protection in Newark, DE
| Zip Code | % Employed | vs State | vs National | |
| 1. | 19717 | 4.6% | 2.6%(+2.05)#7 | 2.1%(+2.50)#3,379 |
| 2. | 19702 | 2.9% | 2.6%(+0.334)#22 | 2.1%(+0.783)#7,506 |
| 3. | 19711 | 2.1% | 2.6%(-0.525)#31 | 2.1%(-0.076)#12,091 |
| 4. | 19713 | 1.8% | 2.6%(-0.798)#38 | 2.1%(-0.349)#13,957 |
1
Common Questions
What are the Top 3 Zip Codes with the Highest Percentage of Population Employed in Security & Protection in Newark, DE?
Top 3 Zip Codes with the Highest Percentage of Population Employed in Security & Protection in Newark, DE are:
What zip code has the Highest Percentage of Population Employed in Security & Protection in Newark, DE?
19717 has the Highest Percentage of Population Employed in Security & Protection in Newark, DE with 4.6%.
What is the Percentage of Population Employed in Security & Protection in Newark, DE?
Percentage of Population Employed in Security & Protection in Newark is 1.7%.
What is the Percentage of Population Employed in Security & Protection in Delaware?
Percentage of Population Employed in Security & Protection in Delaware is 2.6%.
What is the Percentage of Population Employed in Security & Protection in the United States?
Percentage of Population Employed in Security & Protection in the United States is 2.1%.