Zip Codes with the Highest Percentage of Population Employed in Life, Physical & Social Science in Newark, DE
RELATED REPORTS & OPTIONS
Life, Physical & Social Science
Newark
Compare Zip Codes
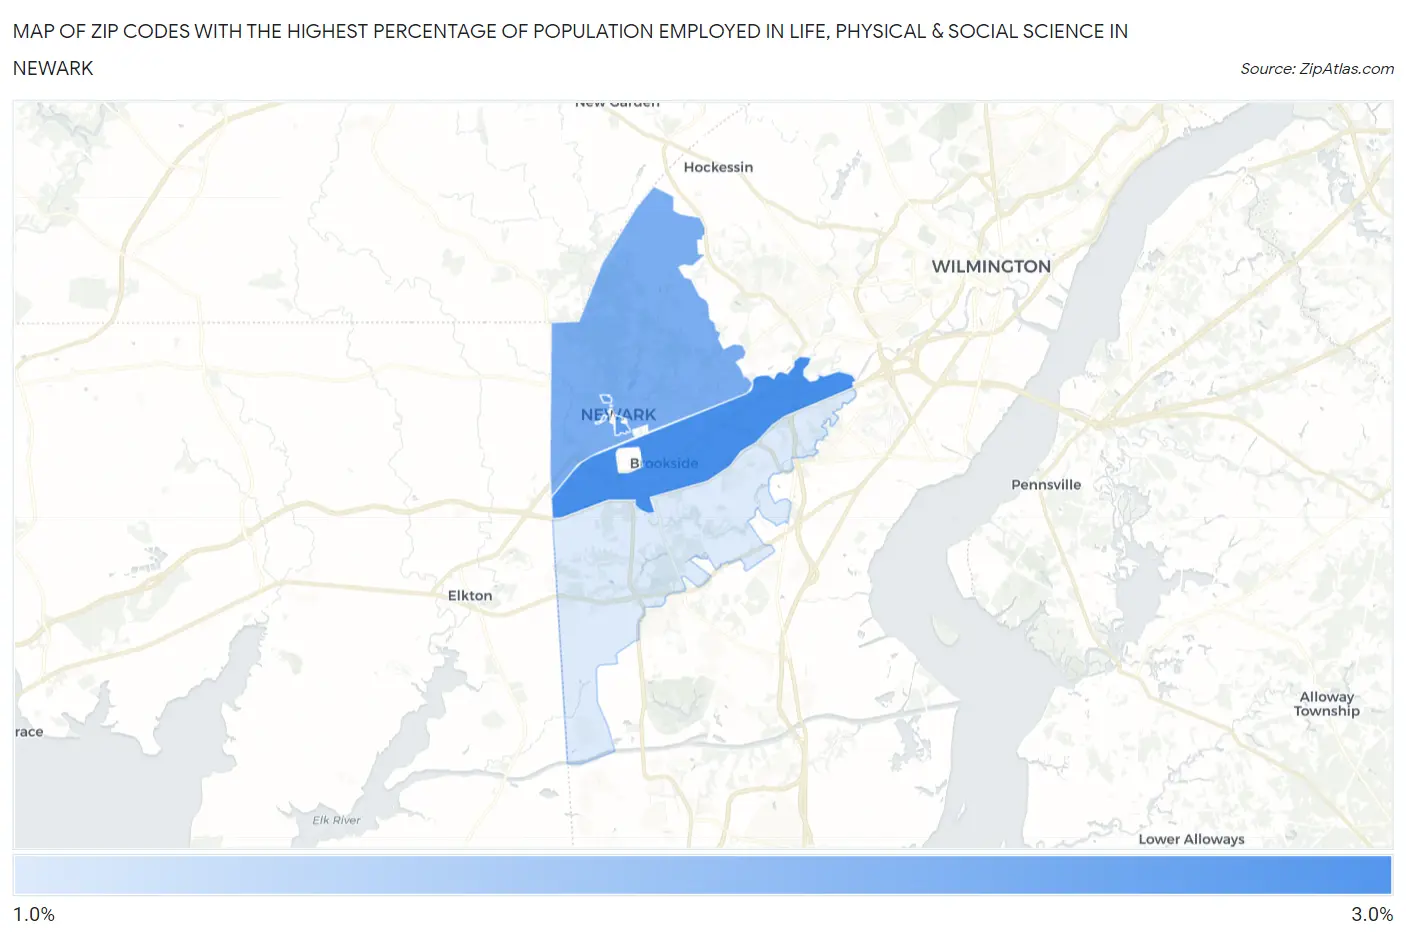
Map of Zip Codes with the Highest Percentage of Population Employed in Life, Physical & Social Science in Newark
1.4%
3.0%
Zip Codes with the Highest Percentage of Population Employed in Life, Physical & Social Science in Newark, DE
| Zip Code | % Employed | vs State | vs National | |
| 1. | 19713 | 3.0% | 1.5%(+1.45)#4 | 1.1%(+1.90)#1,885 |
| 2. | 19717 | 2.7% | 1.5%(+1.20)#6 | 1.1%(+1.66)#2,174 |
| 3. | 19711 | 2.5% | 1.5%(+0.910)#8 | 1.1%(+1.37)#2,649 |
| 4. | 19702 | 1.4% | 1.5%(-0.138)#24 | 1.1%(+0.317)#6,150 |
1
Common Questions
What are the Top 3 Zip Codes with the Highest Percentage of Population Employed in Life, Physical & Social Science in Newark, DE?
Top 3 Zip Codes with the Highest Percentage of Population Employed in Life, Physical & Social Science in Newark, DE are:
What zip code has the Highest Percentage of Population Employed in Life, Physical & Social Science in Newark, DE?
19713 has the Highest Percentage of Population Employed in Life, Physical & Social Science in Newark, DE with 3.0%.
What is the Percentage of Population Employed in Life, Physical & Social Science in Newark, DE?
Percentage of Population Employed in Life, Physical & Social Science in Newark is 3.7%.
What is the Percentage of Population Employed in Life, Physical & Social Science in Delaware?
Percentage of Population Employed in Life, Physical & Social Science in Delaware is 1.5%.
What is the Percentage of Population Employed in Life, Physical & Social Science in the United States?
Percentage of Population Employed in Life, Physical & Social Science in the United States is 1.1%.