Zip Codes with the Highest Percentage of Population Employed in Health Diagnosing & Treating in Newark, DE
RELATED REPORTS & OPTIONS
Health Diagnosing & Treating
Newark
Compare Zip Codes
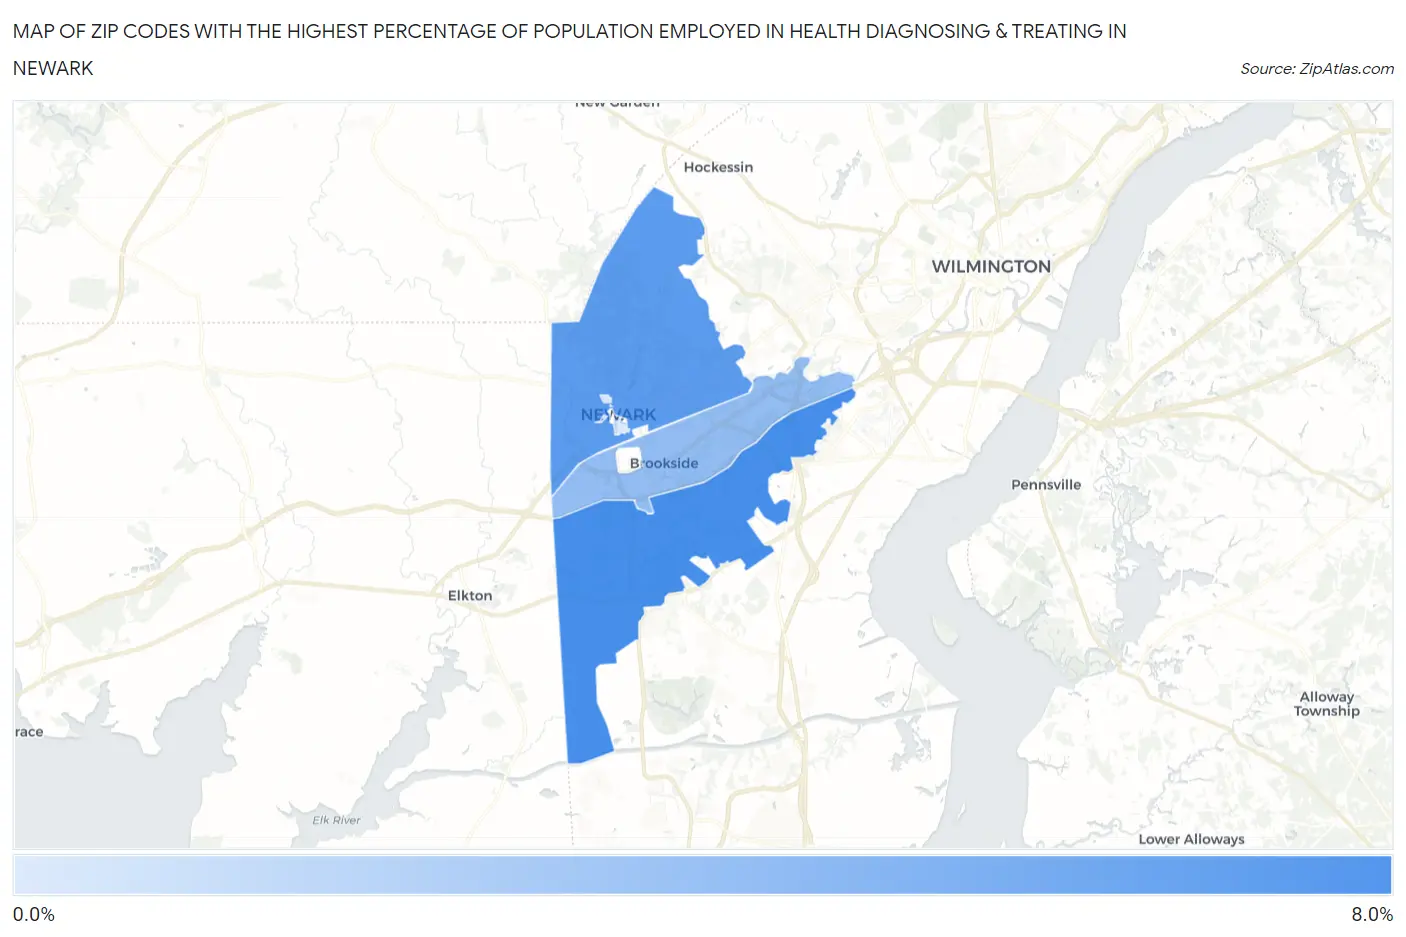
Map of Zip Codes with the Highest Percentage of Population Employed in Health Diagnosing & Treating in Newark
0.90%
6.3%
Zip Codes with the Highest Percentage of Population Employed in Health Diagnosing & Treating in Newark, DE
| Zip Code | % Employed | vs State | vs National | |
| 1. | 19702 | 6.3% | 6.8%(-0.413)#32 | 6.2%(+0.092)#12,623 |
| 2. | 19711 | 5.6% | 6.8%(-1.12)#39 | 6.2%(-0.614)#15,261 |
| 3. | 19713 | 3.5% | 6.8%(-3.23)#53 | 6.2%(-2.72)#22,850 |
| 4. | 19717 | 0.90% | 6.8%(-5.85)#60 | 6.2%(-5.34)#27,959 |
1
Common Questions
What are the Top 3 Zip Codes with the Highest Percentage of Population Employed in Health Diagnosing & Treating in Newark, DE?
Top 3 Zip Codes with the Highest Percentage of Population Employed in Health Diagnosing & Treating in Newark, DE are:
What zip code has the Highest Percentage of Population Employed in Health Diagnosing & Treating in Newark, DE?
19702 has the Highest Percentage of Population Employed in Health Diagnosing & Treating in Newark, DE with 6.3%.
What is the Percentage of Population Employed in Health Diagnosing & Treating in Newark, DE?
Percentage of Population Employed in Health Diagnosing & Treating in Newark is 3.8%.
What is the Percentage of Population Employed in Health Diagnosing & Treating in Delaware?
Percentage of Population Employed in Health Diagnosing & Treating in Delaware is 6.8%.
What is the Percentage of Population Employed in Health Diagnosing & Treating in the United States?
Percentage of Population Employed in Health Diagnosing & Treating in the United States is 6.2%.