Zip Codes with the Highest Percentage of Population Employed in Administrative & Support Services in Newark, DE
RELATED REPORTS & OPTIONS
Administrative & Support Services
Newark
Compare Zip Codes
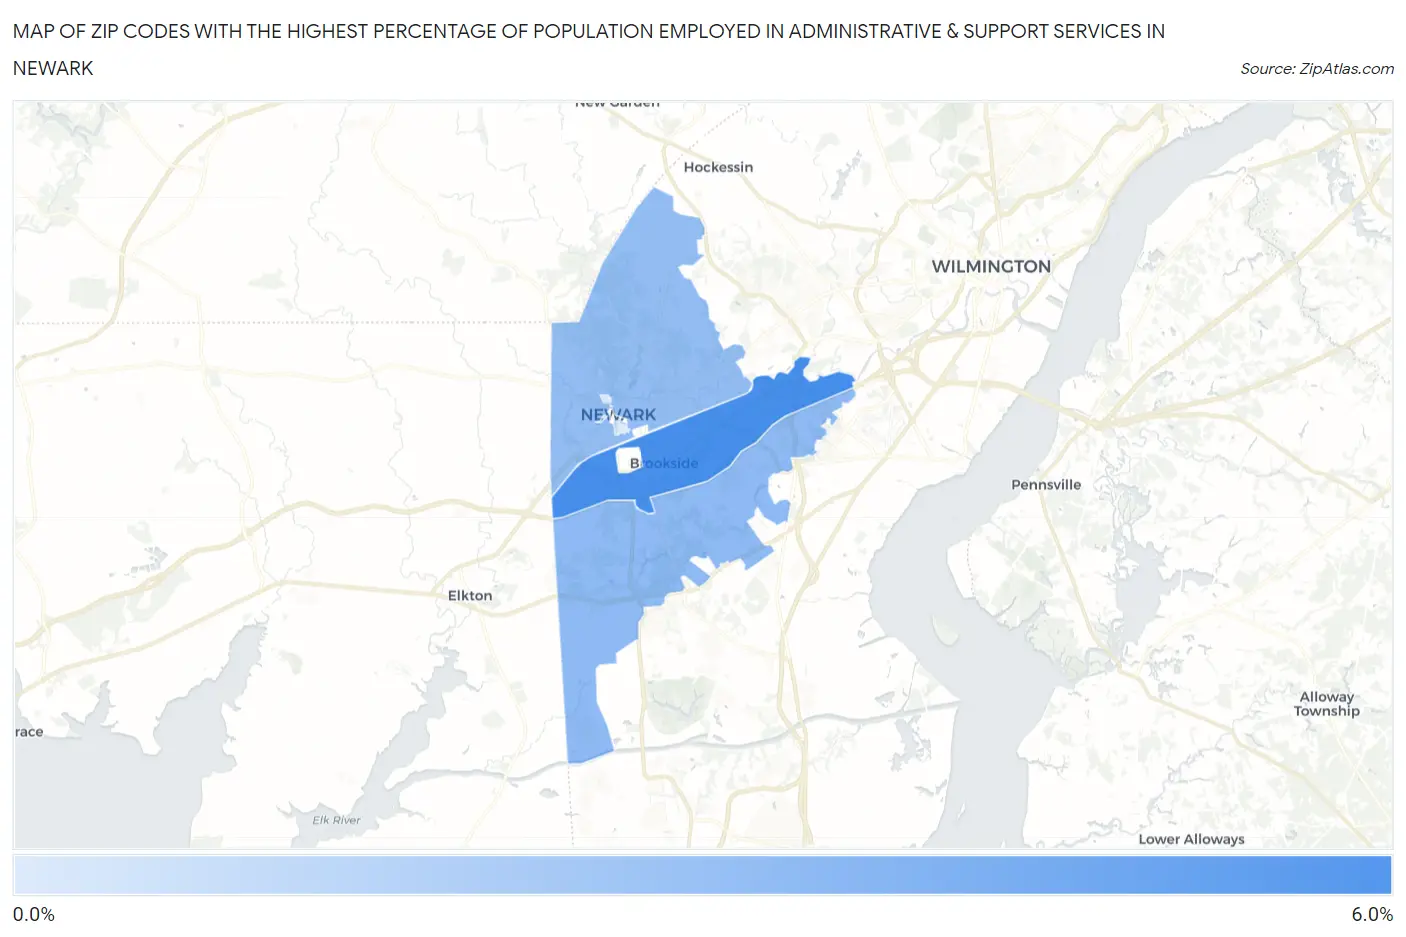
Map of Zip Codes with the Highest Percentage of Population Employed in Administrative & Support Services in Newark
0.85%
5.7%
Zip Codes with the Highest Percentage of Population Employed in Administrative & Support Services in Newark, DE
| Zip Code | % Employed | vs State | vs National | |
| 1. | 19713 | 5.7% | 4.4%(+1.34)#16 | 4.1%(+1.58)#5,290 |
| 2. | 19702 | 3.4% | 4.4%(-0.985)#37 | 4.1%(-0.744)#13,408 |
| 3. | 19711 | 3.2% | 4.4%(-1.20)#41 | 4.1%(-0.959)#14,519 |
| 4. | 19717 | 0.85% | 4.4%(-3.54)#60 | 4.1%(-3.30)#24,963 |
1
Common Questions
What are the Top 3 Zip Codes with the Highest Percentage of Population Employed in Administrative & Support Services in Newark, DE?
Top 3 Zip Codes with the Highest Percentage of Population Employed in Administrative & Support Services in Newark, DE are:
What zip code has the Highest Percentage of Population Employed in Administrative & Support Services in Newark, DE?
19713 has the Highest Percentage of Population Employed in Administrative & Support Services in Newark, DE with 5.7%.
What is the Percentage of Population Employed in Administrative & Support Services in Newark, DE?
Percentage of Population Employed in Administrative & Support Services in Newark is 2.4%.
What is the Percentage of Population Employed in Administrative & Support Services in Delaware?
Percentage of Population Employed in Administrative & Support Services in Delaware is 4.4%.
What is the Percentage of Population Employed in Administrative & Support Services in the United States?
Percentage of Population Employed in Administrative & Support Services in the United States is 4.1%.