Zip Codes with the Highest Percentage of Population Employed in Office & Administration in Newark, DE
RELATED REPORTS & OPTIONS
Office & Administration
Newark
Compare Zip Codes
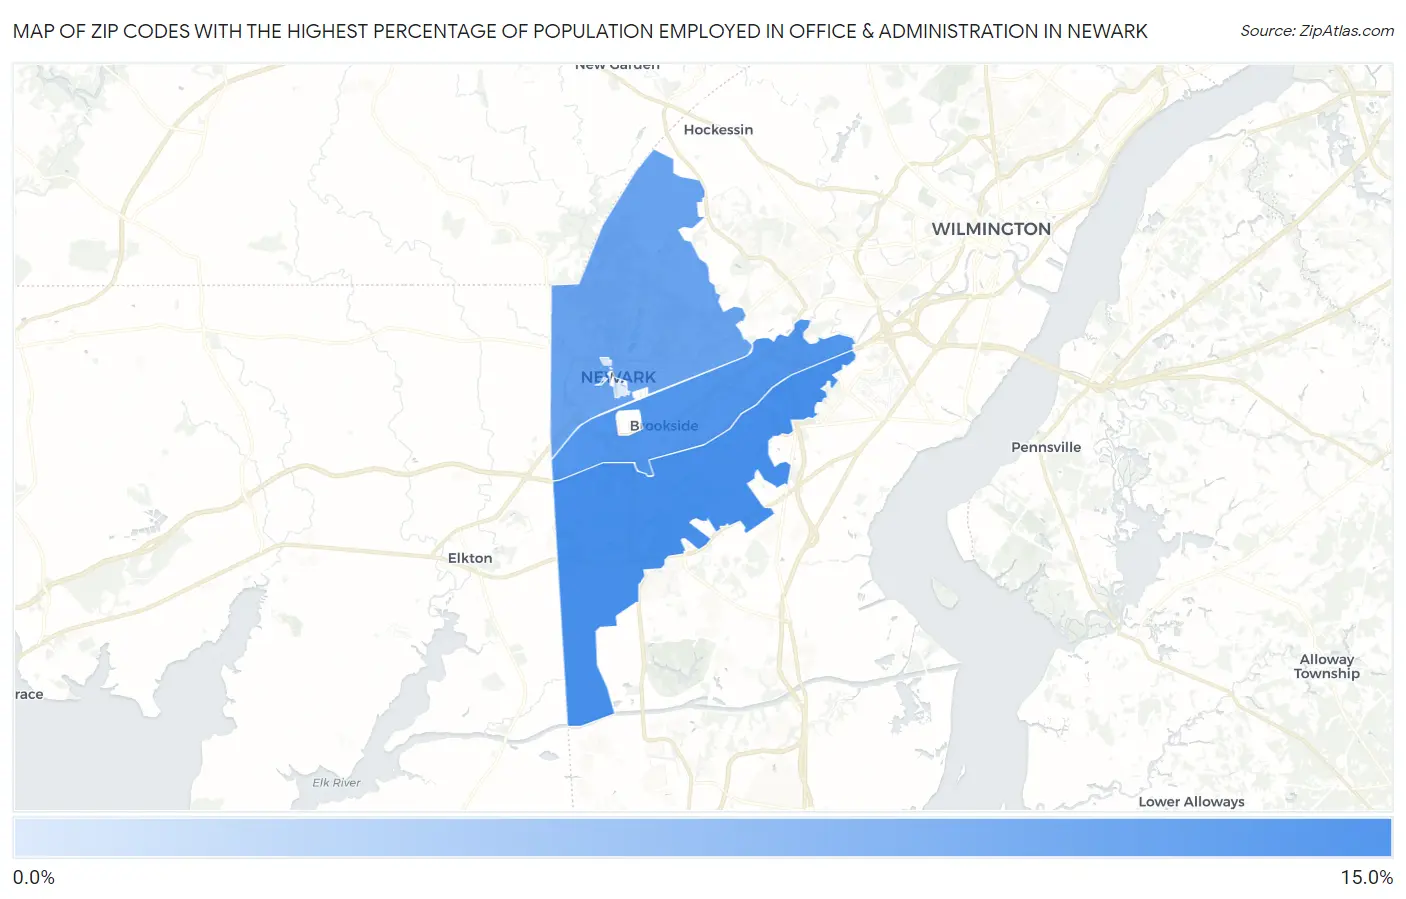
Map of Zip Codes with the Highest Percentage of Population Employed in Office & Administration in Newark
3.6%
12.2%
Zip Codes with the Highest Percentage of Population Employed in Office & Administration in Newark, DE
| Zip Code | % Employed | vs State | vs National | |
| 1. | 19702 | 12.2% | 11.4%(+0.822)#23 | 10.9%(+1.35)#10,134 |
| 2. | 19713 | 11.5% | 11.4%(+0.137)#31 | 10.9%(+0.662)#12,200 |
| 3. | 19711 | 10.3% | 11.4%(-1.13)#39 | 10.9%(-0.600)#16,311 |
| 4. | 19717 | 3.6% | 11.4%(-7.83)#61 | 10.9%(-7.30)#29,328 |
1
Common Questions
What are the Top 3 Zip Codes with the Highest Percentage of Population Employed in Office & Administration in Newark, DE?
Top 3 Zip Codes with the Highest Percentage of Population Employed in Office & Administration in Newark, DE are:
What zip code has the Highest Percentage of Population Employed in Office & Administration in Newark, DE?
19702 has the Highest Percentage of Population Employed in Office & Administration in Newark, DE with 12.2%.
What is the Percentage of Population Employed in Office & Administration in Newark, DE?
Percentage of Population Employed in Office & Administration in Newark is 10.1%.
What is the Percentage of Population Employed in Office & Administration in Delaware?
Percentage of Population Employed in Office & Administration in Delaware is 11.4%.
What is the Percentage of Population Employed in Office & Administration in the United States?
Percentage of Population Employed in Office & Administration in the United States is 10.9%.