Zip Codes with the Highest Percentage of Population Employed in Food Preparation & Serving in Newark, DE
RELATED REPORTS & OPTIONS
Food Preparation & Serving
Newark
Compare Zip Codes
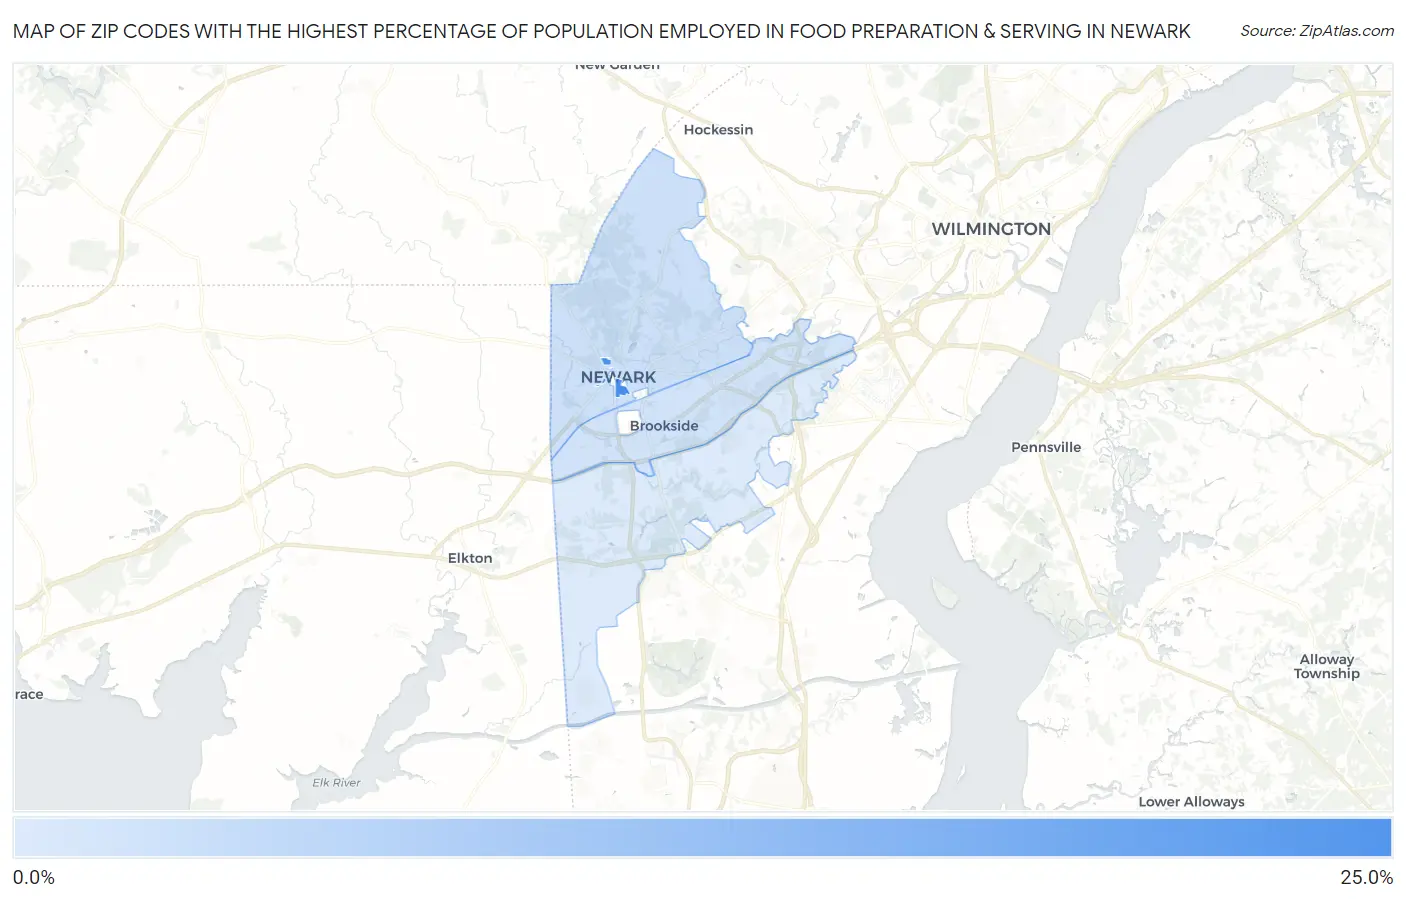
Map of Zip Codes with the Highest Percentage of Population Employed in Food Preparation & Serving in Newark
2.8%
22.1%
Zip Codes with the Highest Percentage of Population Employed in Food Preparation & Serving in Newark, DE
| Zip Code | % Employed | vs State | vs National | |
| 1. | 19717 | 22.1% | 5.0%(+17.2)#1 | 5.3%(+16.8)#416 |
| 2. | 19711 | 4.6% | 5.0%(-0.323)#33 | 5.3%(-0.645)#14,404 |
| 3. | 19713 | 4.3% | 5.0%(-0.668)#40 | 5.3%(-0.991)#15,903 |
| 4. | 19702 | 2.8% | 5.0%(-2.11)#52 | 5.3%(-2.44)#21,865 |
1
Common Questions
What are the Top 3 Zip Codes with the Highest Percentage of Population Employed in Food Preparation & Serving in Newark, DE?
Top 3 Zip Codes with the Highest Percentage of Population Employed in Food Preparation & Serving in Newark, DE are:
What zip code has the Highest Percentage of Population Employed in Food Preparation & Serving in Newark, DE?
19717 has the Highest Percentage of Population Employed in Food Preparation & Serving in Newark, DE with 22.1%.
What is the Percentage of Population Employed in Food Preparation & Serving in Newark, DE?
Percentage of Population Employed in Food Preparation & Serving in Newark is 7.9%.
What is the Percentage of Population Employed in Food Preparation & Serving in Delaware?
Percentage of Population Employed in Food Preparation & Serving in Delaware is 5.0%.
What is the Percentage of Population Employed in Food Preparation & Serving in the United States?
Percentage of Population Employed in Food Preparation & Serving in the United States is 5.3%.