Zip Codes with the Highest Percentage of Population Employed in Security & Protection in Durango, CO
RELATED REPORTS & OPTIONS
Security & Protection
Durango
Compare Zip Codes
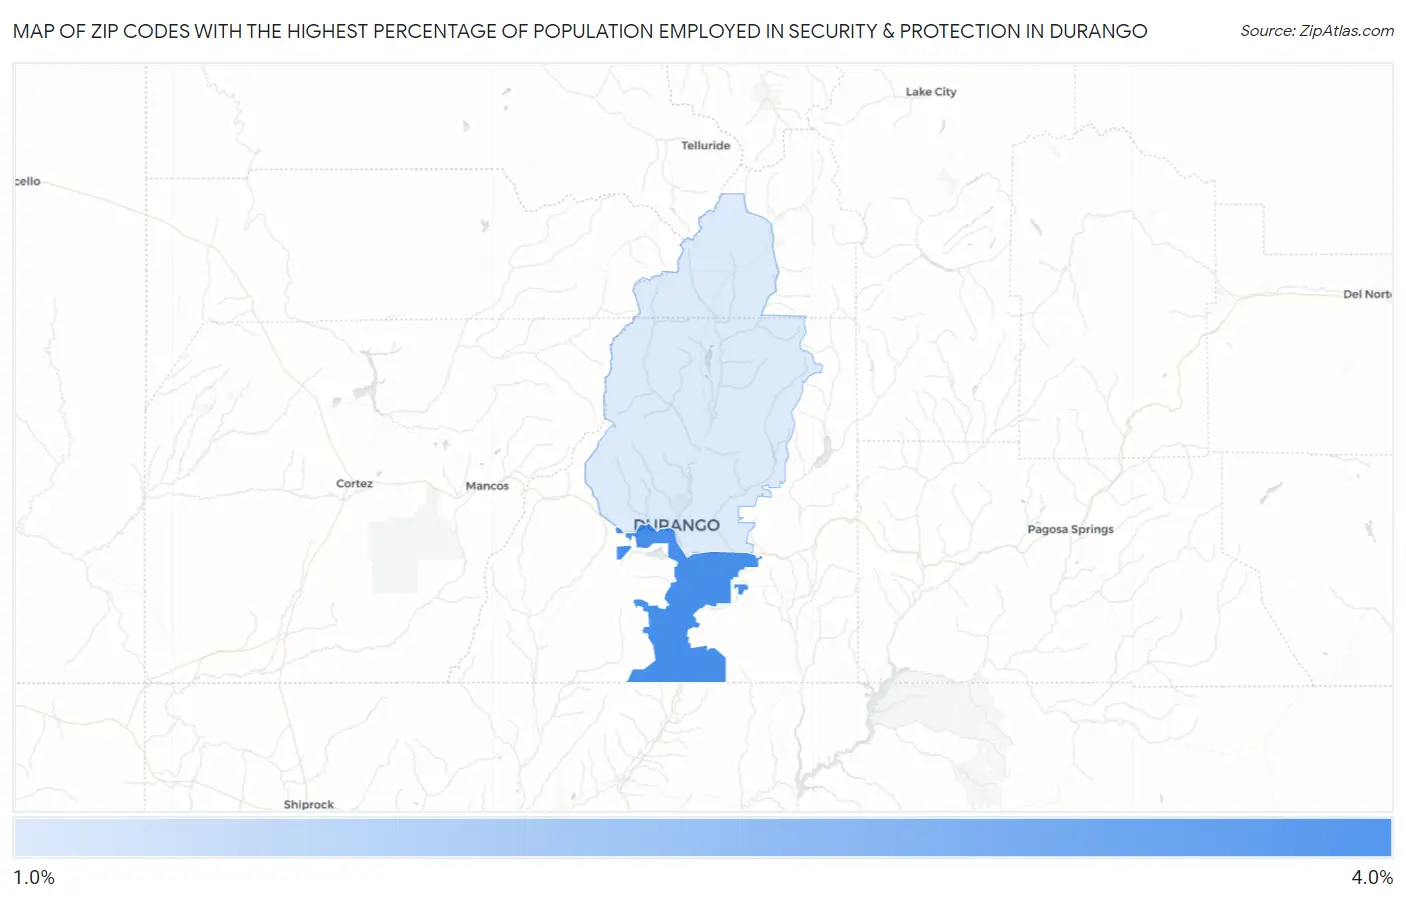
Map of Zip Codes with the Highest Percentage of Population Employed in Security & Protection in Durango
1.8%
3.2%
Zip Codes with the Highest Percentage of Population Employed in Security & Protection in Durango, CO
| Zip Code | % Employed | vs State | vs National | |
| 1. | 81303 | 3.2% | 2.0%(+1.15)#106 | 2.1%(+1.01)#6,681 |
| 2. | 81301 | 1.8% | 2.0%(-0.181)#216 | 2.1%(-0.324)#13,749 |
1
Common Questions
What are the Top Zip Codes with the Highest Percentage of Population Employed in Security & Protection in Durango, CO?
Top Zip Codes with the Highest Percentage of Population Employed in Security & Protection in Durango, CO are:
What zip code has the Highest Percentage of Population Employed in Security & Protection in Durango, CO?
81303 has the Highest Percentage of Population Employed in Security & Protection in Durango, CO with 3.2%.
What is the Percentage of Population Employed in Security & Protection in Durango, CO?
Percentage of Population Employed in Security & Protection in Durango is 2.4%.
What is the Percentage of Population Employed in Security & Protection in Colorado?
Percentage of Population Employed in Security & Protection in Colorado is 2.0%.
What is the Percentage of Population Employed in Security & Protection in the United States?
Percentage of Population Employed in Security & Protection in the United States is 2.1%.