Zip Codes with the Highest Percentage of Population Employed in Security & Protection in Colorado Springs, CO

RELATED REPORTS & OPTIONS

Security & Protection
Population
Families and Households
Female Fertility
Female Fertility (Unmarried)
Race (Community Size)
Race (Percentage)
Ancestry (Community Size)
AfghanAfricanAlaskan AthabascanAlbanianAlsatianAmericanApacheArabArapahoArgentineanArmenianAustralianAustrianBangladeshiBarbadianBasqueBelgianBelizeanBermudanBhutaneseBlackfeetBolivianBrazilianBritishBritish West IndianBulgarianBurmeseCajunCambodianCanadianCape VerdeanCarpatho RusynCelticCentral AmericanCentral American IndianCherokeeCheyenneChickasawChileanChineseChippewaChoctawColombianComancheCosta RicanCreeCreekCroatianCubanCzechCzechoslovakianDanishDelawareDominicanDutchEastern EuropeanEcuadorianEgyptianEnglishEstonianEthiopianEuropeanFilipinoFinnishFrenchFrench CanadianGermanGerman RussianGhanaianGreekGuamanian / ChamorroGuatemalanHaitianHonduranHopiHungarianIcelanderIndian (Asian)IndonesianInupiatIranianIraqiIrishIroquoisIsraeliItalianJamaicanJapaneseJordanianKenyanKoreanLaotianLatvianLebaneseLiberianLithuanianLuxembourgerMacedonianMalaysianMexicanMexican American IndianNative HawaiianNavajoNew ZealanderNicaraguanNigerianNorthern EuropeanNorwegianOkinawanOsagePakistaniPalestinianPanamanianPennsylvania GermanPeruvianPolishPortuguesePotawatomiPuebloPuerto RicanRomanianRussianSalvadoranSamoanScandinavianScotch-IrishScottishSeminoleSerbianShoshoneSiouxSlavicSlovakSloveneSomaliSouth AfricanSouth AmericanSouth American IndianSpaniardSpanishSpanish AmericanSpanish American IndianSri LankanSubsaharan AfricanSudaneseSwedishSwissSyrianThaiTohono O'OdhamTrinidadian and TobagonianTurkishUkrainianUteVenezuelanWelshWest IndianYaquiYugoslavian
Ancestry (Percentage)
AfghanAfricanAlaskan AthabascanAlbanianAlsatianAmericanApacheArabArapahoArgentineanArmenianAustralianAustrianBangladeshiBarbadianBasqueBelgianBelizeanBermudanBhutaneseBlackfeetBolivianBrazilianBritishBritish West IndianBulgarianBurmeseCajunCambodianCanadianCape VerdeanCarpatho RusynCelticCentral AmericanCentral American IndianCherokeeCheyenneChickasawChileanChineseChippewaChoctawColombianComancheCosta RicanCreeCreekCroatianCubanCzechCzechoslovakianDanishDelawareDominicanDutchEastern EuropeanEcuadorianEgyptianEnglishEstonianEthiopianEuropeanFilipinoFinnishFrenchFrench CanadianGermanGerman RussianGhanaianGreekGuamanian / ChamorroGuatemalanHaitianHonduranHopiHungarianIcelanderIndian (Asian)IndonesianInupiatIranianIraqiIrishIroquoisIsraeliItalianJamaicanJapaneseJordanianKenyanKoreanLaotianLatvianLebaneseLiberianLithuanianLuxembourgerMacedonianMalaysianMexicanMexican American IndianNative HawaiianNavajoNew ZealanderNicaraguanNigerianNorthern EuropeanNorwegianOkinawanOsagePakistaniPalestinianPanamanianPennsylvania GermanPeruvianPolishPortuguesePotawatomiPuebloPuerto RicanRomanianRussianSalvadoranSamoanScandinavianScotch-IrishScottishSeminoleSerbianShoshoneSiouxSlavicSlovakSloveneSomaliSouth AfricanSouth AmericanSouth American IndianSpaniardSpanishSpanish AmericanSpanish American IndianSri LankanSubsaharan AfricanSudaneseSwedishSwissSyrianThaiTohono O'OdhamTrinidadian and TobagonianTurkishUkrainianUteVenezuelanWelshWest IndianYaquiYugoslavian
Immigrant Origin (Total)
AfghanistanAfricaArgentinaArmeniaAsiaAustraliaAustriaBangladeshBarbadosBelarusBoliviaBosnia and HerzegovinaBrazilBulgariaBurma / MyanmarCambodiaCameroonCanadaCaribbeanCentral AmericaChileChinaColombiaCosta RicaCroatiaCubaCzechoslovakiaDenmarkDominican RepublicEastern AfricaEastern AsiaEastern EuropeEcuadorEgyptEl SalvadorEnglandEritreaEthiopiaEuropeFranceGermanyGhanaGuatemalaGuyanaHaitiHondurasHong KongHungaryIndiaIndonesiaIranIraqIrelandIsraelItalyJamaicaJapanKazakhstanKenyaKoreaLaosLatin AmericaLebanonLiberiaLithuaniaMexicoMiddle AfricaMoldovaNepalNetherlandsNicaraguaNigeriaNorth MacedoniaNorthern AfricaNorthern EuropeNorwayOceaniaPakistanPanamaPeruPhilippinesPolandRomaniaRussiaScotlandSingaporeSomaliaSouth AfricaSouth AmericaSouth Central AsiaSouth Eastern AsiaSouthern EuropeSpainSt. Vincent and the GrenadinesSwedenSwitzerlandSyriaTaiwanThailandTrinidad and TobagoTurkeyUgandaUkraineUzbekistanVenezuelaVietnamWest IndiesWestern AfricaWestern AsiaWestern EuropeZaireZimbabwe
Immigrant Origin (Percentage)
AfghanistanAfricaArgentinaArmeniaAsiaAustraliaAustriaBangladeshBarbadosBelarusBoliviaBosnia and HerzegovinaBrazilBulgariaBurma / MyanmarCambodiaCameroonCanadaCaribbeanCentral AmericaChileChinaColombiaCosta RicaCroatiaCubaCzechoslovakiaDenmarkDominican RepublicEastern AfricaEastern AsiaEastern EuropeEcuadorEgyptEl SalvadorEnglandEritreaEthiopiaEuropeFranceGermanyGhanaGuatemalaGuyanaHaitiHondurasHong KongHungaryIndiaIndonesiaIranIraqIrelandIsraelItalyJamaicaJapanKazakhstanKenyaKoreaLaosLatin AmericaLebanonLiberiaLithuaniaMexicoMiddle AfricaMoldovaNepalNetherlandsNicaraguaNigeriaNorth MacedoniaNorthern AfricaNorthern EuropeNorwayOceaniaPakistanPanamaPeruPhilippinesPolandRomaniaRussiaScotlandSingaporeSomaliaSouth AfricaSouth AmericaSouth Central AsiaSouth Eastern AsiaSouthern EuropeSpainSt. Vincent and the GrenadinesSwedenSwitzerlandSyriaTaiwanThailandTrinidad and TobagoTurkeyUgandaUkraineUzbekistanVenezuelaVietnamWest IndiesWestern AfricaWestern AsiaWestern EuropeZaireZimbabwe
Income
Income (Families)
Income (Households)
Poverty
Poverty (Families)
Unemployment
Employment Occupations
Employment Industries
Employer Class
Commute Time
Commute Means
School Enrollment
Education by Degree Field
Occupancy
Finances
Physical Characteristics
Colorado Springs
Compare Zip Codes
Comparison Subject

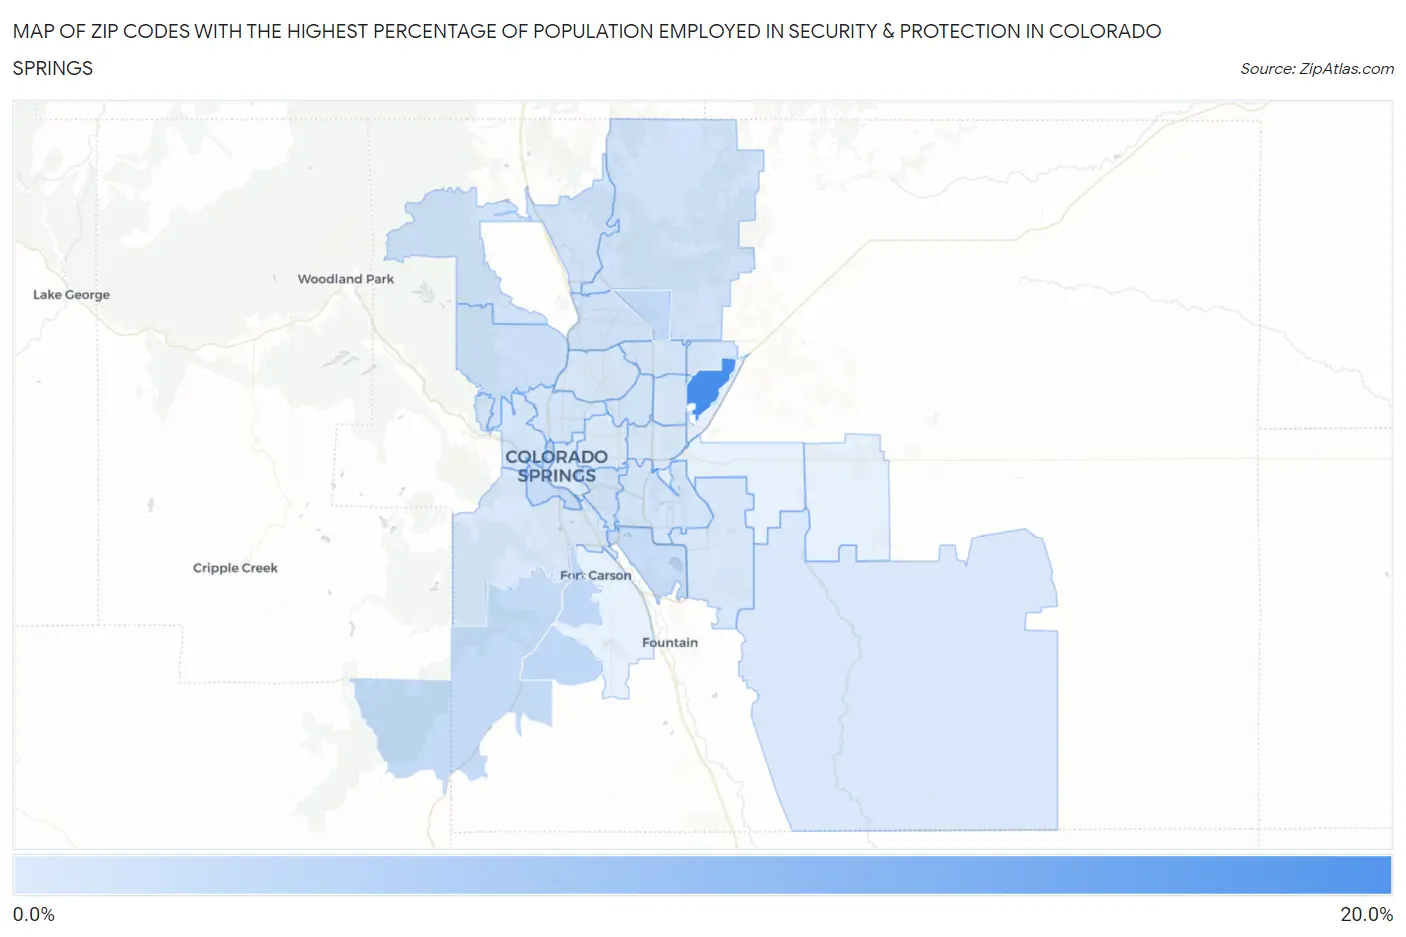
Map of Zip Codes with the Highest Percentage of Population Employed in Security & Protection in Colorado Springs

0.0%
20.0%
Zip Codes with the Highest Percentage of Population Employed in Security & Protection in Colorado Springs Map

Zip Codes with the Highest Percentage of Population Employed in Security & Protection in Colorado Springs, CO

Zip Code % Employed vs State vs National
1.8093818.5%2.0%(+16.4)#42.1%(+16.3)#235
2.809024.6%2.0%(+2.56)#582.1%(+2.41)#3,499
3.809244.4%2.0%(+2.37)#642.1%(+2.22)#3,820
4.809264.0%2.0%(+2.01)#742.1%(+1.87)#4,461
5.809113.5%2.0%(+1.51)#972.1%(+1.36)#5,638
6.809053.4%2.0%(+1.36)#992.1%(+1.21)#6,044
7.809192.8%2.0%(+0.829)#1232.1%(+0.686)#7,944
8.809202.6%2.0%(+0.642)#1312.1%(+0.498)#8,784
9.809212.6%2.0%(+0.598)#1362.1%(+0.455)#8,991
10.809102.6%2.0%(+0.587)#1382.1%(+0.443)#9,045
11.809082.6%2.0%(+0.582)#1392.1%(+0.438)#9,067
12.809162.3%2.0%(+0.329)#1622.1%(+0.186)#10,435
13.809172.2%2.0%(+0.233)#1722.1%(+0.089)#11,029
14.809232.1%2.0%(+0.141)#1782.1%(-0.002)#11,594
15.809272.1%2.0%(+0.116)#1812.1%(-0.028)#11,756
16.809072.1%2.0%(+0.107)#1852.1%(-0.037)#11,826
17.809042.0%2.0%(+0.021)#1972.1%(-0.122)#12,382
18.809221.9%2.0%(-0.063)#2042.1%(-0.207)#12,942
19.809151.9%2.0%(-0.129)#2102.1%(-0.273)#13,400
20.809251.9%2.0%(-0.145)#2122.1%(-0.288)#13,490
21.809181.8%2.0%(-0.230)#2212.1%(-0.374)#14,131
22.809281.7%2.0%(-0.293)#2332.1%(-0.436)#14,583
23.809061.7%2.0%(-0.306)#2392.1%(-0.450)#14,698
24.809091.4%2.0%(-0.602)#2752.1%(-0.746)#16,927
25.809031.4%2.0%(-0.642)#2792.1%(-0.785)#17,227

Common Questions

What are the Top 10 Zip Codes with the Highest Percentage of Population Employed in Security & Protection in Colorado Springs, CO?
Top 10 Zip Codes with the Highest Percentage of Population Employed in Security & Protection in Colorado Springs, CO are:
#1
18.5%
#2
4.6%
#3
4.4%
#4
4.0%
#5
3.5%
#6
3.4%
#7
2.8%
#8
2.6%
#9
2.6%
#10
2.6%
What zip code has the Highest Percentage of Population Employed in Security & Protection in Colorado Springs, CO?
80938 has the Highest Percentage of Population Employed in Security & Protection in Colorado Springs, CO with 18.5%.
What is the Percentage of Population Employed in Security & Protection in Colorado Springs, CO?
Percentage of Population Employed in Security & Protection in Colorado Springs is 2.2%.
What is the Percentage of Population Employed in Security & Protection in Colorado?
Percentage of Population Employed in Security & Protection in Colorado is 2.0%.
What is the Percentage of Population Employed in Security & Protection in the United States?
Percentage of Population Employed in Security & Protection in the United States is 2.1%.