Zip Codes with the Highest Percentage of Population Employed in Security & Protection in Aurora, CO
RELATED REPORTS & OPTIONS
Security & Protection
Aurora
Compare Zip Codes
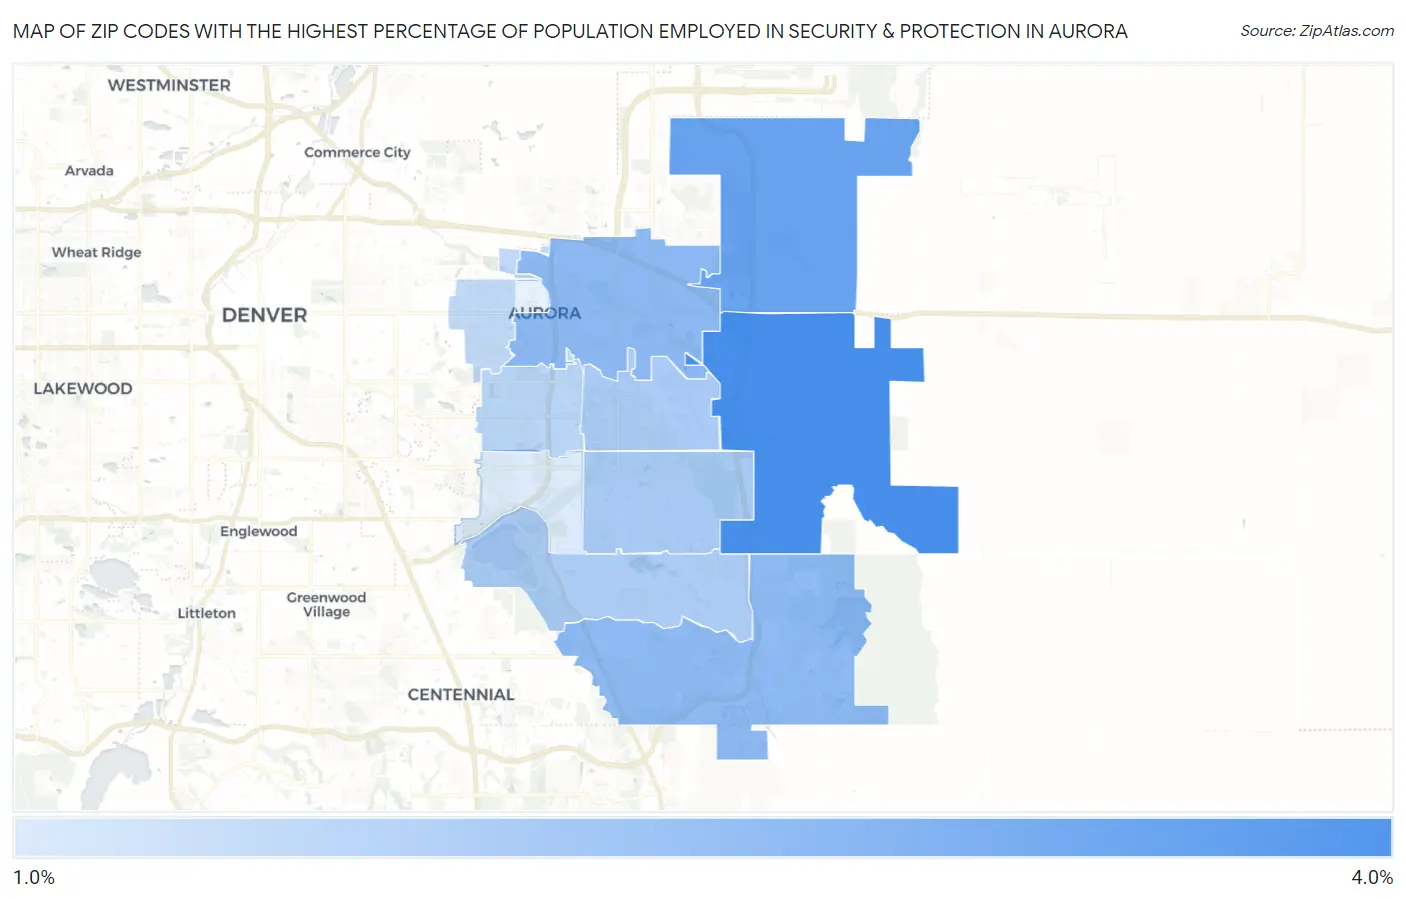
Map of Zip Codes with the Highest Percentage of Population Employed in Security & Protection in Aurora
1.6%
3.3%
Zip Codes with the Highest Percentage of Population Employed in Security & Protection in Aurora, CO
| Zip Code | % Employed | vs State | vs National | |
| 1. | 80018 | 3.3% | 2.0%(+1.34)#100 | 2.1%(+1.19)#6,118 |
| 2. | 80019 | 2.9% | 2.0%(+0.937)#116 | 2.1%(+0.794)#7,464 |
| 3. | 80011 | 2.5% | 2.0%(+0.504)#145 | 2.1%(+0.360)#9,467 |
| 4. | 80016 | 2.5% | 2.0%(+0.484)#150 | 2.1%(+0.340)#9,576 |
| 5. | 80013 | 2.2% | 2.0%(+0.167)#175 | 2.1%(+0.024)#11,433 |
| 6. | 80017 | 2.1% | 2.0%(+0.140)#179 | 2.1%(-0.004)#11,607 |
| 7. | 80015 | 2.1% | 2.0%(+0.115)#183 | 2.1%(-0.029)#11,763 |
| 8. | 80012 | 2.0% | 2.0%(-0.039)#203 | 2.1%(-0.183)#12,784 |
| 9. | 80010 | 1.9% | 2.0%(-0.113)#206 | 2.1%(-0.257)#13,284 |
| 10. | 80014 | 1.6% | 2.0%(-0.450)#251 | 2.1%(-0.594)#15,768 |
1
Common Questions
What are the Top 10 Zip Codes with the Highest Percentage of Population Employed in Security & Protection in Aurora, CO?
Top 10 Zip Codes with the Highest Percentage of Population Employed in Security & Protection in Aurora, CO are:
What zip code has the Highest Percentage of Population Employed in Security & Protection in Aurora, CO?
80018 has the Highest Percentage of Population Employed in Security & Protection in Aurora, CO with 3.3%.
What is the Percentage of Population Employed in Security & Protection in Aurora, CO?
Percentage of Population Employed in Security & Protection in Aurora is 2.2%.
What is the Percentage of Population Employed in Security & Protection in Colorado?
Percentage of Population Employed in Security & Protection in Colorado is 2.0%.
What is the Percentage of Population Employed in Security & Protection in the United States?
Percentage of Population Employed in Security & Protection in the United States is 2.1%.