Zip Codes with the Highest Percentage of Households with Income Above $100,000 in Brighton, CO
RELATED REPORTS & OPTIONS
Household Income | $100k+
Brighton
Compare Zip Codes
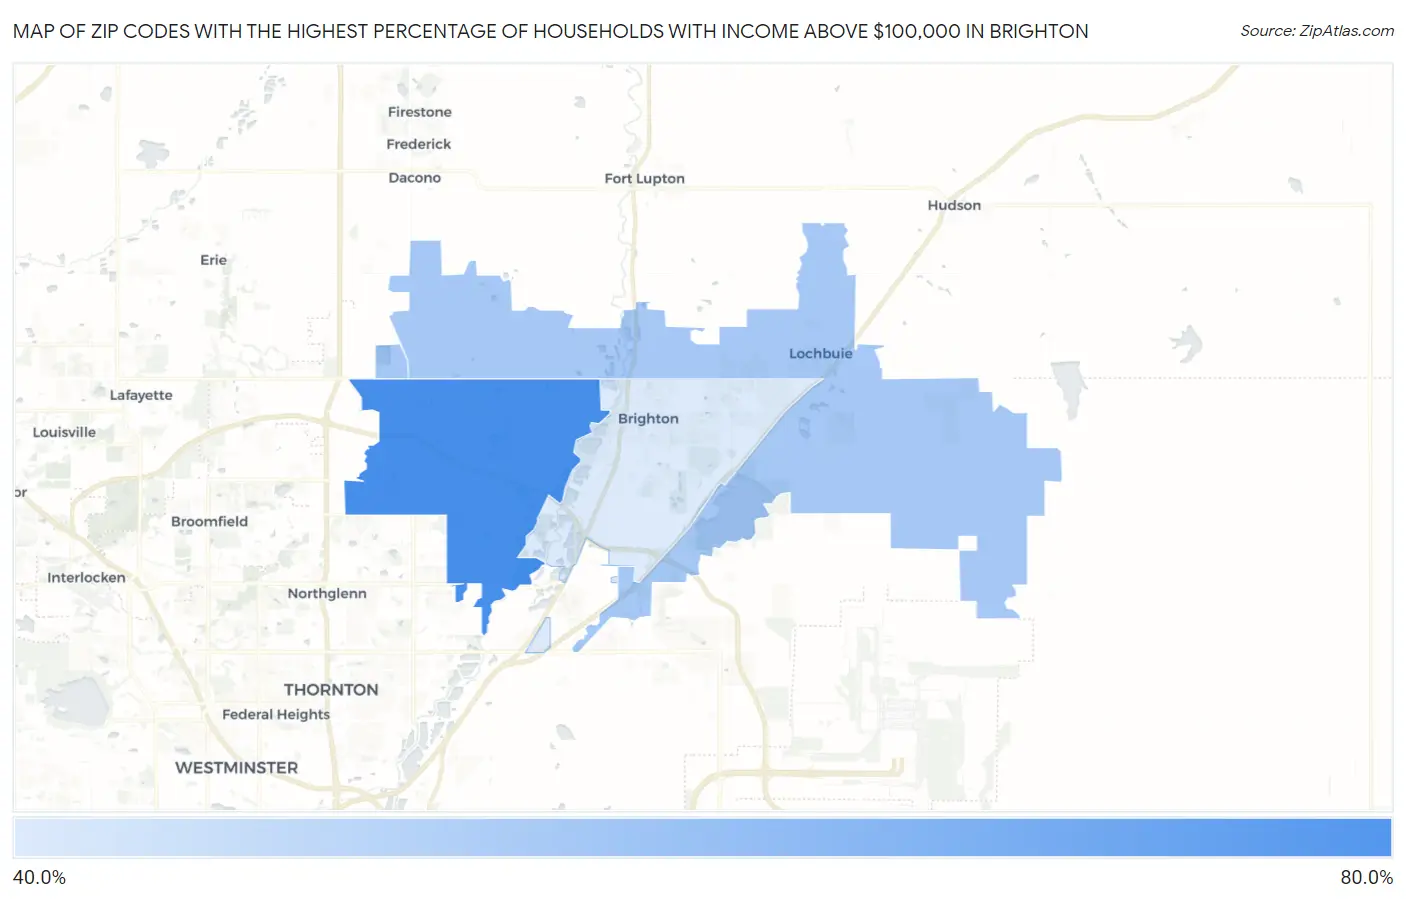
Map of Zip Codes with the Highest Percentage of Households with Income Above $100,000 in Brighton
42.6%
71.7%
Zip Codes with the Highest Percentage of Households with Income Above $100,000 in Brighton, CO
| Zip Code | Households with Income > $100k | vs State | vs National | |
| 1. | 80602 | 71.7% | 43.9%(+27.8)#16 | 37.3%(+34.4)#803 |
| 2. | 80603 | 52.8% | 43.9%(+8.90)#93 | 37.3%(+15.5)#4,027 |
| 3. | 80601 | 42.6% | 43.9%(-1.30)#168 | 37.3%(+5.30)#7,604 |
1
Common Questions
What are the Top Zip Codes with the Highest Percentage of Households with Income Above $100,000 in Brighton, CO?
Top Zip Codes with the Highest Percentage of Households with Income Above $100,000 in Brighton, CO are:
What zip code has the Highest Percentage of Households with Income Above $100,000 in Brighton, CO?
80602 has the Highest Percentage of Households with Income Above $100,000 in Brighton, CO with 71.7%.
What is the Percentage of Households with Income Above $100,000 in Brighton, CO?
Percentage of Households with Income Above $100,000 in Brighton is 43.2%.
What is the Percentage of Households with Income Above $100,000 in Colorado?
Percentage of Households with Income Above $100,000 in Colorado is 43.9%.
What is the Percentage of Households with Income Above $100,000 in the United States?
Percentage of Households with Income Above $100,000 in the United States is 37.3%.