Zip Codes with the Highest Percentage of Population with a Degree in Visual and Performing Arts in Brighton, CO
RELATED REPORTS & OPTIONS
Visual and Performing Arts
Brighton
Compare Zip Codes
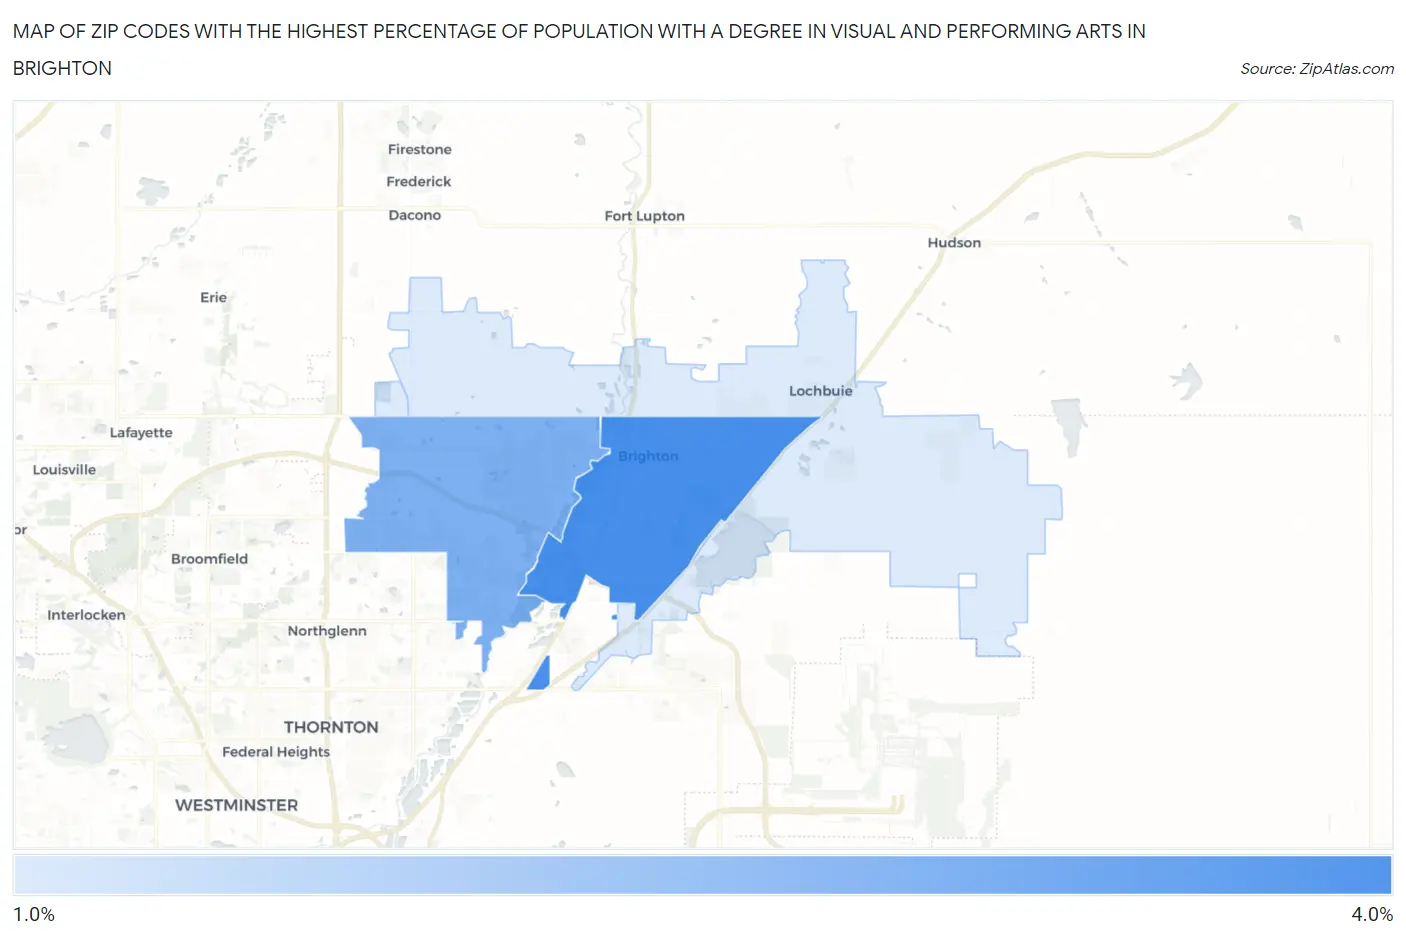
Map of Zip Codes with the Highest Percentage of Population with a Degree in Visual and Performing Arts in Brighton
1.5%
3.6%
Zip Codes with the Highest Percentage of Population with a Degree in Visual and Performing Arts in Brighton, CO
| Zip Code | % Graduates | vs State | vs National | |
| 1. | 80601 | 3.6% | 4.3%(-0.732)#207 | 4.3%(-0.658)#10,520 |
| 2. | 80602 | 2.9% | 4.3%(-1.46)#252 | 4.3%(-1.39)#13,235 |
| 3. | 80603 | 1.5% | 4.3%(-2.81)#329 | 4.3%(-2.73)#18,092 |
1
Common Questions
What are the Top Zip Codes with the Highest Percentage of Population with a Degree in Visual and Performing Arts in Brighton, CO?
Top Zip Codes with the Highest Percentage of Population with a Degree in Visual and Performing Arts in Brighton, CO are:
What zip code has the Highest Percentage of Population with a Degree in Visual and Performing Arts in Brighton, CO?
80601 has the Highest Percentage of Population with a Degree in Visual and Performing Arts in Brighton, CO with 3.6%.
What is the Percentage of Population with a Degree in Visual and Performing Arts in Brighton, CO?
Percentage of Population with a Degree in Visual and Performing Arts in Brighton is 4.0%.
What is the Percentage of Population with a Degree in Visual and Performing Arts in Colorado?
Percentage of Population with a Degree in Visual and Performing Arts in Colorado is 4.3%.
What is the Percentage of Population with a Degree in Visual and Performing Arts in the United States?
Percentage of Population with a Degree in Visual and Performing Arts in the United States is 4.3%.