Zip Codes with the Highest Percentage of Population Employed in Installation, Maintenance & Repair in Brighton, CO
RELATED REPORTS & OPTIONS
Installation, Maintenance & Repair
Brighton
Compare Zip Codes
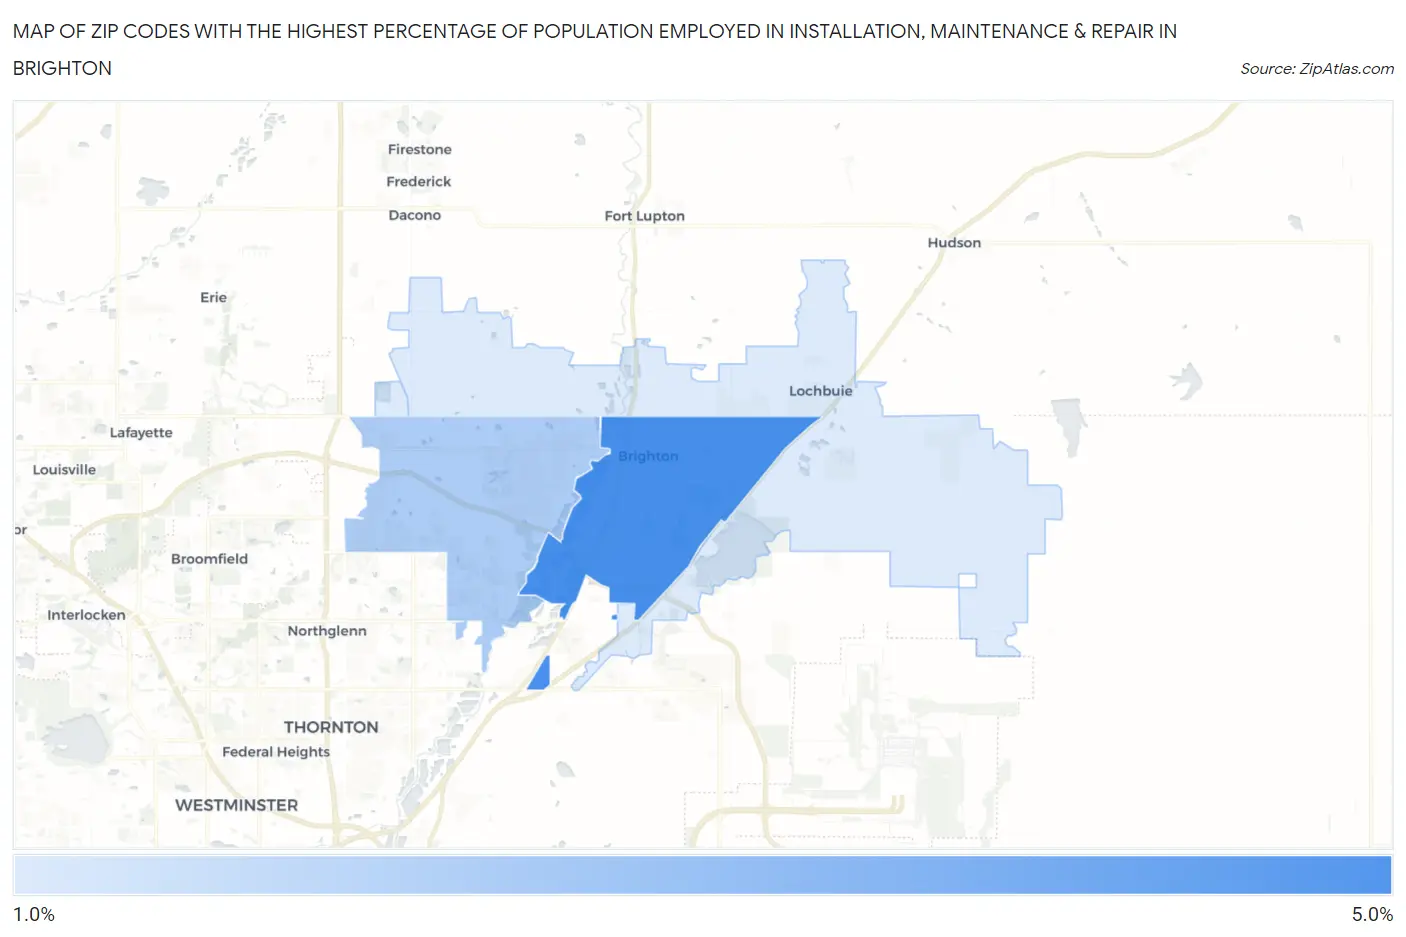
Map of Zip Codes with the Highest Percentage of Population Employed in Installation, Maintenance & Repair in Brighton
1.3%
4.7%
Zip Codes with the Highest Percentage of Population Employed in Installation, Maintenance & Repair in Brighton, CO
| Zip Code | % Employed | vs State | vs National | |
| 1. | 80601 | 4.7% | 2.8%(+1.92)#123 | 3.1%(+1.68)#9,520 |
| 2. | 80602 | 2.4% | 2.8%(-0.429)#273 | 3.1%(-0.675)#20,098 |
| 3. | 80603 | 1.3% | 2.8%(-1.57)#361 | 3.1%(-1.81)#25,060 |
1
Common Questions
What are the Top Zip Codes with the Highest Percentage of Population Employed in Installation, Maintenance & Repair in Brighton, CO?
Top Zip Codes with the Highest Percentage of Population Employed in Installation, Maintenance & Repair in Brighton, CO are:
What zip code has the Highest Percentage of Population Employed in Installation, Maintenance & Repair in Brighton, CO?
80601 has the Highest Percentage of Population Employed in Installation, Maintenance & Repair in Brighton, CO with 4.7%.
What is the Percentage of Population Employed in Installation, Maintenance & Repair in Brighton, CO?
Percentage of Population Employed in Installation, Maintenance & Repair in Brighton is 4.8%.
What is the Percentage of Population Employed in Installation, Maintenance & Repair in Colorado?
Percentage of Population Employed in Installation, Maintenance & Repair in Colorado is 2.8%.
What is the Percentage of Population Employed in Installation, Maintenance & Repair in the United States?
Percentage of Population Employed in Installation, Maintenance & Repair in the United States is 3.1%.