Zip Codes with the Highest Percentage of Population with a Degree in Visual and Performing Arts in El Monte, CA
RELATED REPORTS & OPTIONS
Visual and Performing Arts
El Monte
Compare Zip Codes
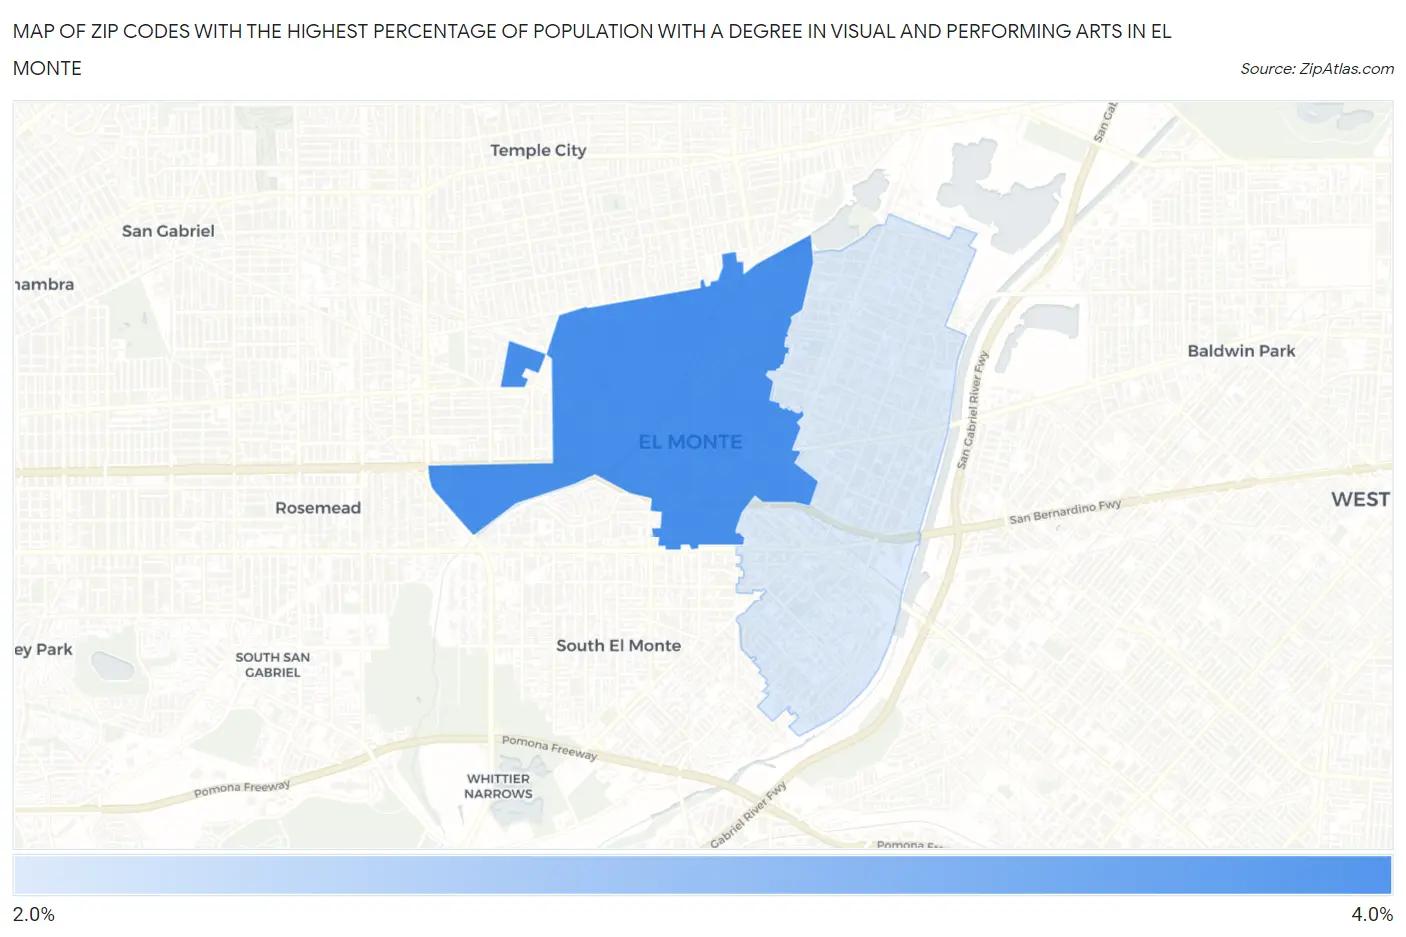
Map of Zip Codes with the Highest Percentage of Population with a Degree in Visual and Performing Arts in El Monte
2.2%
3.4%
Zip Codes with the Highest Percentage of Population with a Degree in Visual and Performing Arts in El Monte, CA
| Zip Code | % Graduates | vs State | vs National | |
| 1. | 91731 | 3.4% | 5.7%(-2.33)#1,017 | 4.3%(-0.844)#11,229 |
| 2. | 91732 | 2.2% | 5.7%(-3.49)#1,239 | 4.3%(-2.00)#15,533 |
1
Common Questions
What are the Top Zip Codes with the Highest Percentage of Population with a Degree in Visual and Performing Arts in El Monte, CA?
Top Zip Codes with the Highest Percentage of Population with a Degree in Visual and Performing Arts in El Monte, CA are:
What zip code has the Highest Percentage of Population with a Degree in Visual and Performing Arts in El Monte, CA?
91731 has the Highest Percentage of Population with a Degree in Visual and Performing Arts in El Monte, CA with 3.4%.
What is the Percentage of Population with a Degree in Visual and Performing Arts in El Monte, CA?
Percentage of Population with a Degree in Visual and Performing Arts in El Monte is 2.5%.
What is the Percentage of Population with a Degree in Visual and Performing Arts in California?
Percentage of Population with a Degree in Visual and Performing Arts in California is 5.7%.
What is the Percentage of Population with a Degree in Visual and Performing Arts in the United States?
Percentage of Population with a Degree in Visual and Performing Arts in the United States is 4.3%.