Zip Codes with the Highest Percentage of Renter-Occupied Units in San Jose, CA
RELATED REPORTS & OPTIONS
Highest Renter-Occupied
San Jose
Compare Zip Codes
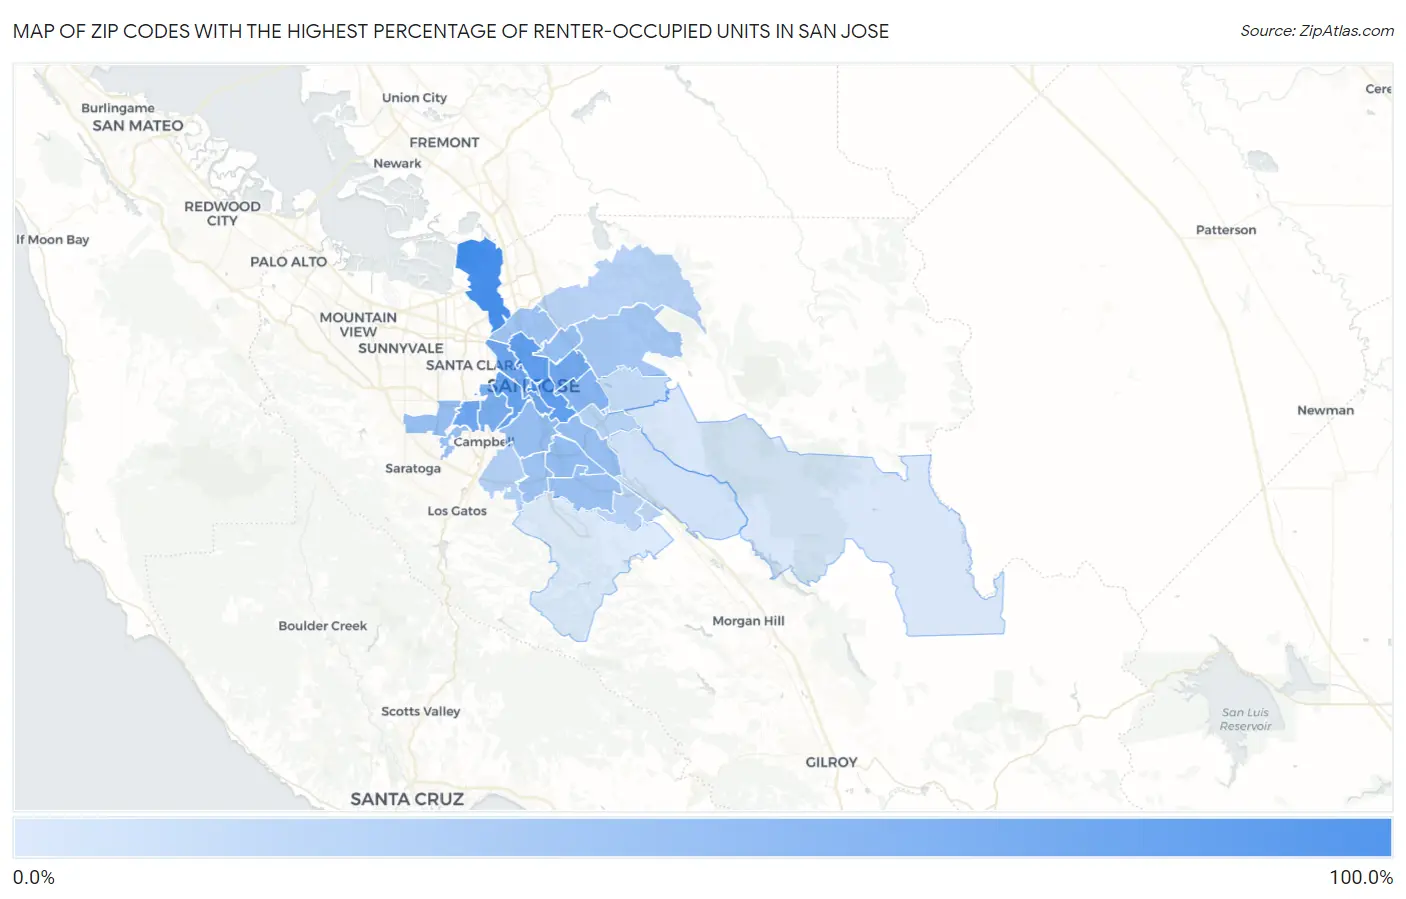
Map of Zip Codes with the Highest Percentage of Renter-Occupied Units in San Jose
0.0%
100.0%
Zip Codes with the Highest Percentage of Renter-Occupied Units in San Jose, CA
| Zip Code | % Renter-Occupied | vs State | vs National | |
| 1. | 95134 | 87.0% | 44.4%(+42.6)#59 | 35.2%(+51.8)#524 |
| 2. | 95113 | 84.6% | 44.4%(+40.2)#65 | 35.2%(+49.4)#563 |
| 3. | 95112 | 71.5% | 44.4%(+27.1)#136 | 35.2%(+36.3)#987 |
| 4. | 95126 | 65.5% | 44.4%(+21.1)#203 | 35.2%(+30.3)#1,352 |
| 5. | 95117 | 62.3% | 44.4%(+17.9)#247 | 35.2%(+27.1)#1,608 |
| 6. | 95110 | 61.8% | 44.4%(+17.5)#257 | 35.2%(+26.7)#1,648 |
| 7. | 95116 | 60.4% | 44.4%(+16.0)#276 | 35.2%(+25.2)#1,762 |
| 8. | 95128 | 55.7% | 44.4%(+11.4)#347 | 35.2%(+20.6)#2,239 |
| 9. | 95122 | 49.4% | 44.4%(+5.02)#484 | 35.2%(+14.2)#3,195 |
| 10. | 95136 | 42.9% | 44.4%(-1.52)#657 | 35.2%(+7.67)#4,620 |
| 11. | 95111 | 41.4% | 44.4%(-2.93)#700 | 35.2%(+6.26)#4,978 |
| 12. | 95129 | 41.0% | 44.4%(-3.39)#712 | 35.2%(+5.80)#5,119 |
| 13. | 95125 | 41.0% | 44.4%(-3.40)#714 | 35.2%(+5.79)#5,122 |
| 14. | 95133 | 40.8% | 44.4%(-3.59)#721 | 35.2%(+5.60)#5,178 |
| 15. | 95123 | 39.7% | 44.4%(-4.69)#757 | 35.2%(+4.50)#5,501 |
| 16. | 95130 | 39.2% | 44.4%(-5.14)#774 | 35.2%(+4.04)#5,645 |
| 17. | 95131 | 36.8% | 44.4%(-7.56)#859 | 35.2%(+1.63)#6,568 |
| 18. | 95118 | 36.6% | 44.4%(-7.73)#866 | 35.2%(+1.46)#6,650 |
| 19. | 95127 | 34.2% | 44.4%(-10.2)#958 | 35.2%(-1.03)#7,780 |
| 20. | 95124 | 26.8% | 44.4%(-17.6)#1,224 | 35.2%(-8.40)#12,251 |
| 21. | 95119 | 26.6% | 44.4%(-17.8)#1,232 | 35.2%(-8.63)#12,424 |
| 22. | 95132 | 26.3% | 44.4%(-18.0)#1,237 | 35.2%(-8.84)#12,569 |
| 23. | 95121 | 25.2% | 44.4%(-19.2)#1,270 | 35.2%(-9.98)#13,430 |
| 24. | 95139 | 24.4% | 44.4%(-20.0)#1,297 | 35.2%(-10.8)#14,157 |
| 25. | 95148 | 20.3% | 44.4%(-24.1)#1,414 | 35.2%(-14.9)#17,907 |
| 26. | 95138 | 15.8% | 44.4%(-28.6)#1,518 | 35.2%(-19.4)#22,332 |
| 27. | 95135 | 12.5% | 44.4%(-31.9)#1,591 | 35.2%(-22.7)#25,399 |
| 28. | 95120 | 11.1% | 44.4%(-33.3)#1,611 | 35.2%(-24.1)#26,558 |
1
Common Questions
What are the Top 10 Zip Codes with the Highest Percentage of Renter-Occupied Units in San Jose, CA?
Top 10 Zip Codes with the Highest Percentage of Renter-Occupied Units in San Jose, CA are:
What zip code has the Highest Percentage of Renter-Occupied Units in San Jose, CA?
95134 has the Highest Percentage of Renter-Occupied Units in San Jose, CA with 87.0%.
What is the Percentage of Renter-Occupied Units in San Jose, CA?
Percentage of Renter-Occupied Units in San Jose is 44.2%.
What is the Percentage of Renter-Occupied Units in California?
Percentage of Renter-Occupied Units in California is 44.4%.
What is the Percentage of Renter-Occupied Units in the United States?
Percentage of Renter-Occupied Units in the United States is 35.2%.