Zip Codes with the Highest Percentage of Population Employed in Real Estate, Rental & Leasing in Manteca, CA
RELATED REPORTS & OPTIONS
Real Estate, Rental & Leasing
Manteca
Compare Zip Codes
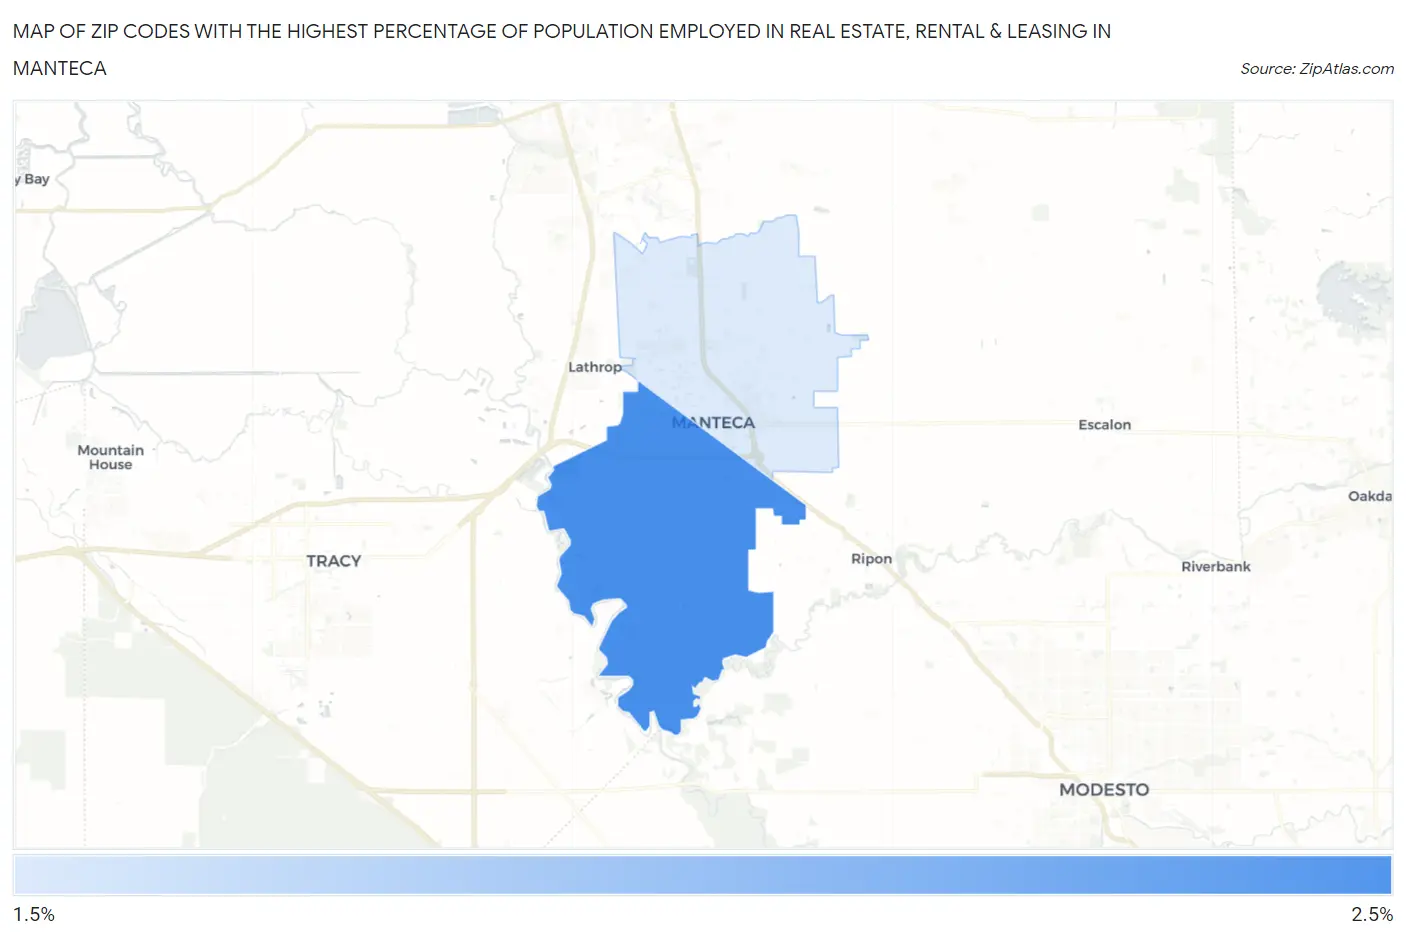
Map of Zip Codes with the Highest Percentage of Population Employed in Real Estate, Rental & Leasing in Manteca
1.8%
2.1%
Zip Codes with the Highest Percentage of Population Employed in Real Estate, Rental & Leasing in Manteca, CA
| Zip Code | % Employed | vs State | vs National | |
| 1. | 95337 | 2.1% | 2.1%(-0.026)#656 | 1.9%(+0.201)#7,354 |
| 2. | 95336 | 1.8% | 2.1%(-0.320)#797 | 1.9%(-0.092)#9,137 |
1
Common Questions
What are the Top Zip Codes with the Highest Percentage of Population Employed in Real Estate, Rental & Leasing in Manteca, CA?
Top Zip Codes with the Highest Percentage of Population Employed in Real Estate, Rental & Leasing in Manteca, CA are:
What zip code has the Highest Percentage of Population Employed in Real Estate, Rental & Leasing in Manteca, CA?
95337 has the Highest Percentage of Population Employed in Real Estate, Rental & Leasing in Manteca, CA with 2.1%.
What is the Percentage of Population Employed in Real Estate, Rental & Leasing in Manteca, CA?
Percentage of Population Employed in Real Estate, Rental & Leasing in Manteca is 1.7%.
What is the Percentage of Population Employed in Real Estate, Rental & Leasing in California?
Percentage of Population Employed in Real Estate, Rental & Leasing in California is 2.1%.
What is the Percentage of Population Employed in Real Estate, Rental & Leasing in the United States?
Percentage of Population Employed in Real Estate, Rental & Leasing in the United States is 1.9%.