Zip Codes with the Highest Percentage of Population Employed in Real Estate, Rental & Leasing in Yuba City, CA
RELATED REPORTS & OPTIONS
Real Estate, Rental & Leasing
Yuba City
Compare Zip Codes
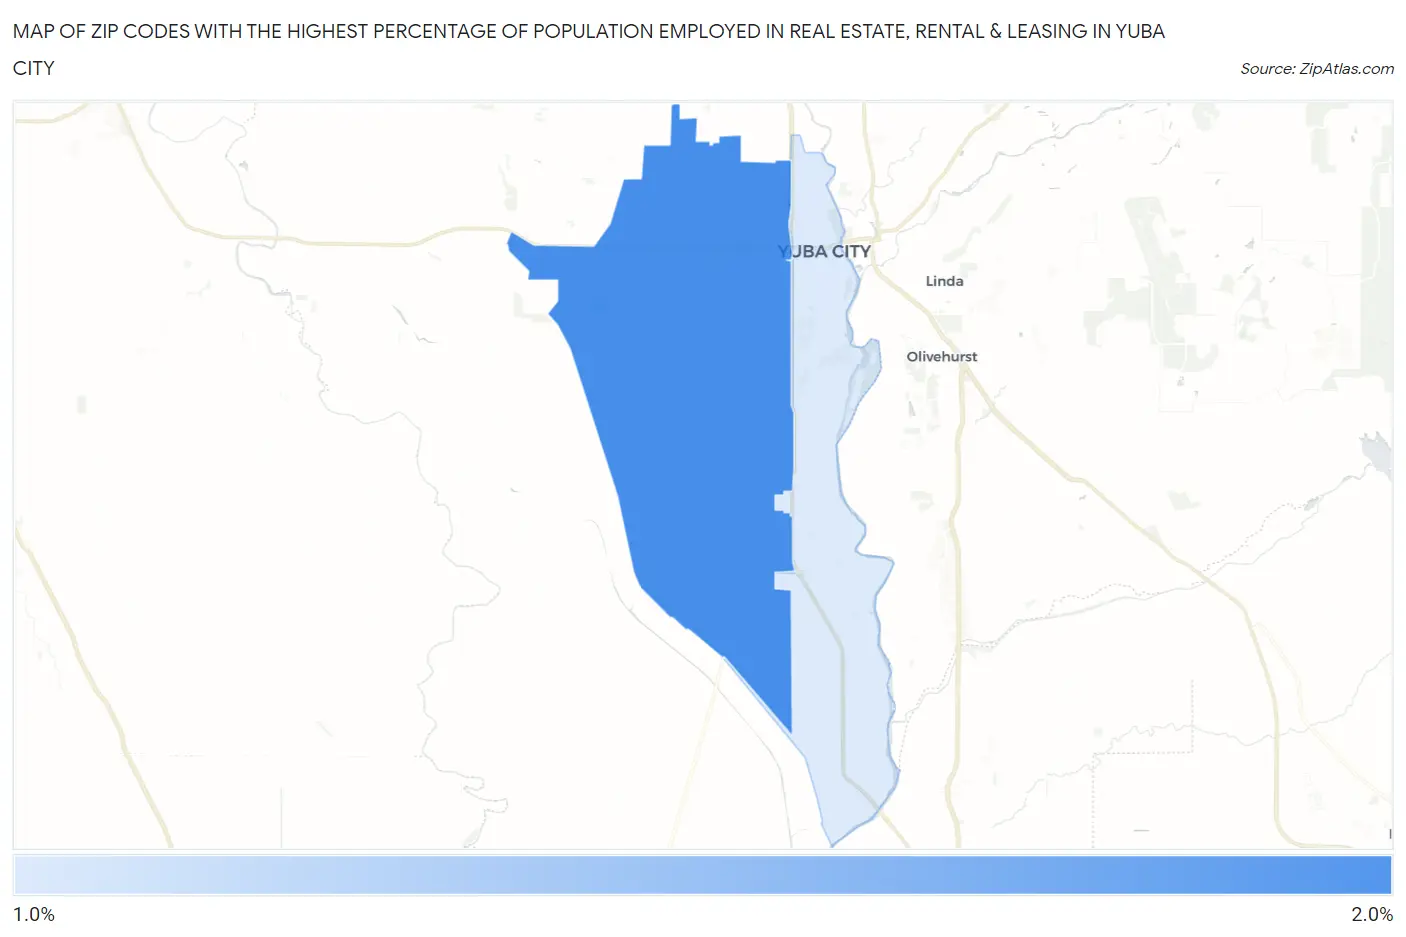
Map of Zip Codes with the Highest Percentage of Population Employed in Real Estate, Rental & Leasing in Yuba City
1.4%
1.7%
Zip Codes with the Highest Percentage of Population Employed in Real Estate, Rental & Leasing in Yuba City, CA
| Zip Code | % Employed | vs State | vs National | |
| 1. | 95993 | 1.7% | 2.1%(-0.421)#853 | 1.9%(-0.194)#9,771 |
| 2. | 95991 | 1.4% | 2.1%(-0.723)#990 | 1.9%(-0.495)#12,008 |
1
Common Questions
What are the Top Zip Codes with the Highest Percentage of Population Employed in Real Estate, Rental & Leasing in Yuba City, CA?
Top Zip Codes with the Highest Percentage of Population Employed in Real Estate, Rental & Leasing in Yuba City, CA are:
What zip code has the Highest Percentage of Population Employed in Real Estate, Rental & Leasing in Yuba City, CA?
95993 has the Highest Percentage of Population Employed in Real Estate, Rental & Leasing in Yuba City, CA with 1.7%.
What is the Percentage of Population Employed in Real Estate, Rental & Leasing in Yuba City, CA?
Percentage of Population Employed in Real Estate, Rental & Leasing in Yuba City is 1.8%.
What is the Percentage of Population Employed in Real Estate, Rental & Leasing in California?
Percentage of Population Employed in Real Estate, Rental & Leasing in California is 2.1%.
What is the Percentage of Population Employed in Real Estate, Rental & Leasing in the United States?
Percentage of Population Employed in Real Estate, Rental & Leasing in the United States is 1.9%.