Zip Codes with the Highest Percentage of Population Employed in Real Estate, Rental & Leasing in San Clemente, CA
RELATED REPORTS & OPTIONS
Real Estate, Rental & Leasing
San Clemente
Compare Zip Codes
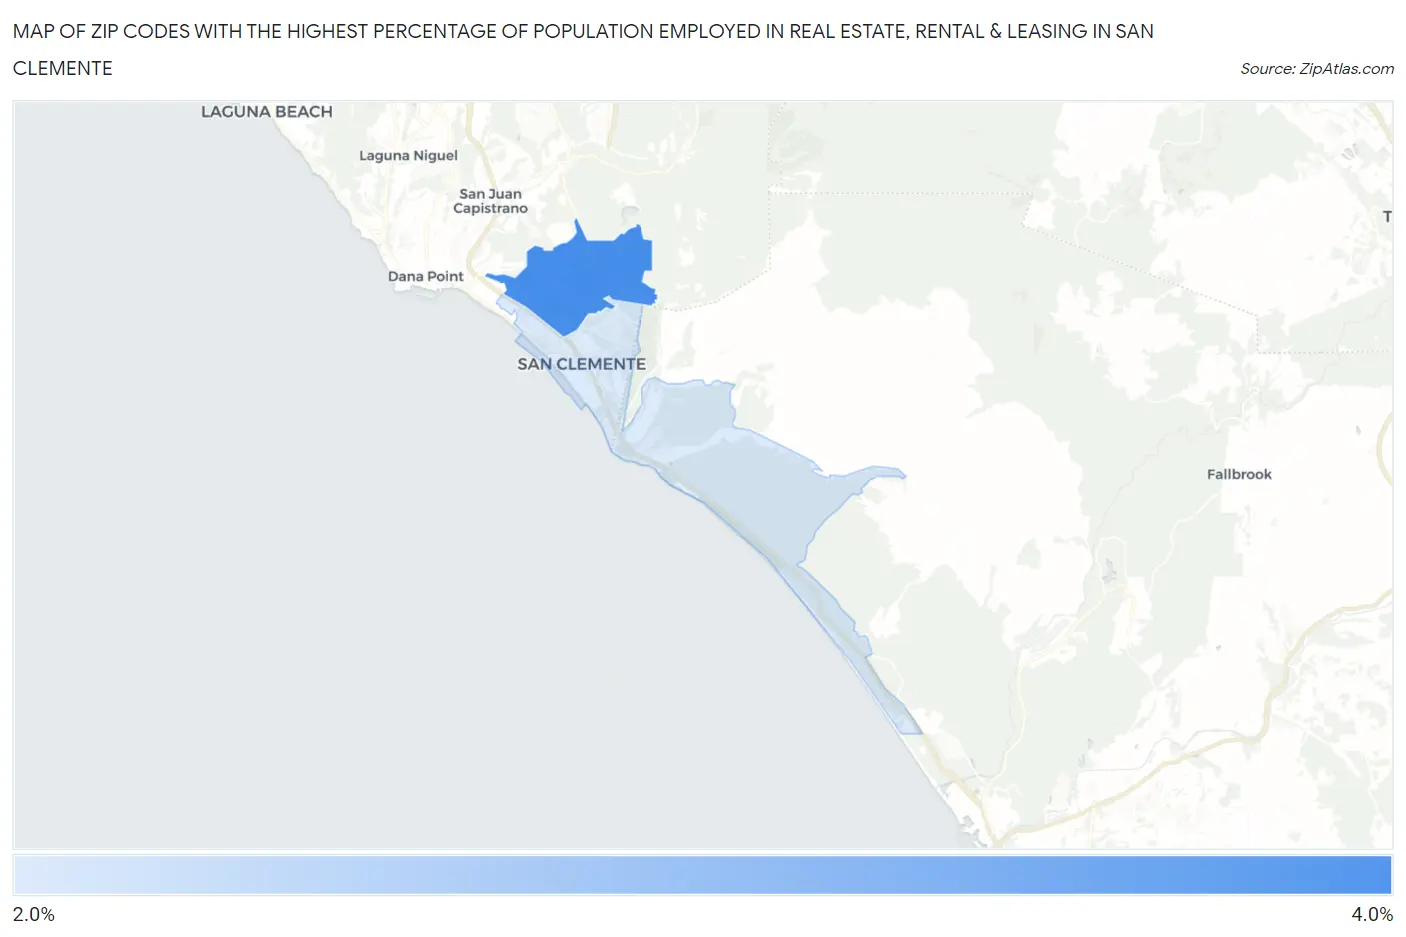
Map of Zip Codes with the Highest Percentage of Population Employed in Real Estate, Rental & Leasing in San Clemente
2.9%
3.3%
Zip Codes with the Highest Percentage of Population Employed in Real Estate, Rental & Leasing in San Clemente, CA
| Zip Code | % Employed | vs State | vs National | |
| 1. | 92673 | 3.3% | 2.1%(+1.14)#309 | 1.9%(+1.36)#3,308 |
| 2. | 92672 | 2.9% | 2.1%(+0.761)#385 | 1.9%(+0.989)#4,224 |
1
Common Questions
What are the Top Zip Codes with the Highest Percentage of Population Employed in Real Estate, Rental & Leasing in San Clemente, CA?
Top Zip Codes with the Highest Percentage of Population Employed in Real Estate, Rental & Leasing in San Clemente, CA are:
What zip code has the Highest Percentage of Population Employed in Real Estate, Rental & Leasing in San Clemente, CA?
92673 has the Highest Percentage of Population Employed in Real Estate, Rental & Leasing in San Clemente, CA with 3.3%.
What is the Percentage of Population Employed in Real Estate, Rental & Leasing in San Clemente, CA?
Percentage of Population Employed in Real Estate, Rental & Leasing in San Clemente is 3.1%.
What is the Percentage of Population Employed in Real Estate, Rental & Leasing in California?
Percentage of Population Employed in Real Estate, Rental & Leasing in California is 2.1%.
What is the Percentage of Population Employed in Real Estate, Rental & Leasing in the United States?
Percentage of Population Employed in Real Estate, Rental & Leasing in the United States is 1.9%.