Zip Codes with the Highest Percentage of Population Employed in Real Estate, Rental & Leasing in Woodland, CA
RELATED REPORTS & OPTIONS
Real Estate, Rental & Leasing
Woodland
Compare Zip Codes
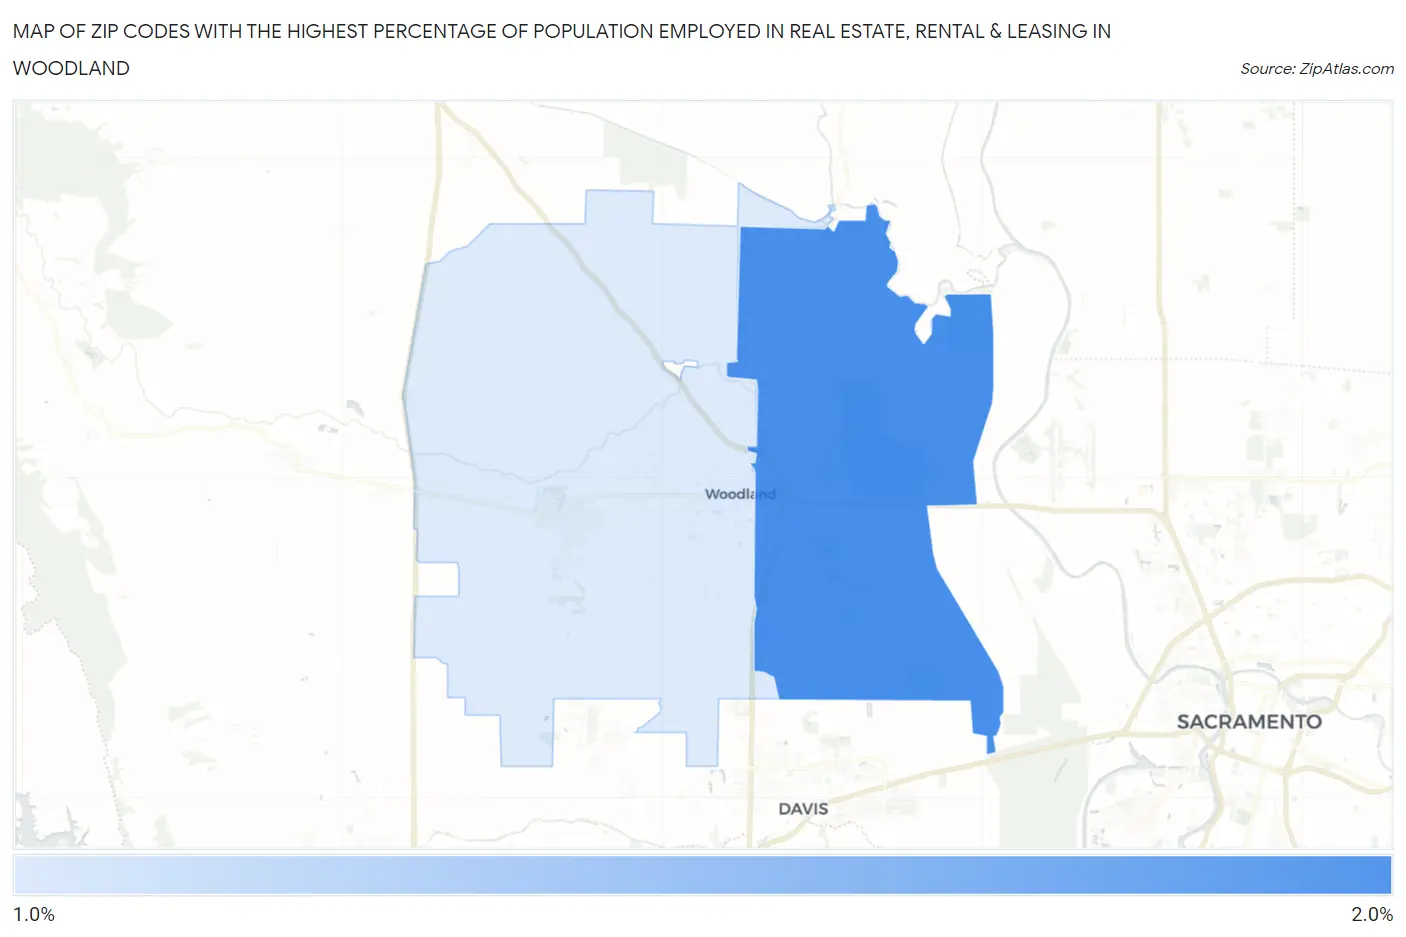
Map of Zip Codes with the Highest Percentage of Population Employed in Real Estate, Rental & Leasing in Woodland
1.4%
1.7%
Zip Codes with the Highest Percentage of Population Employed in Real Estate, Rental & Leasing in Woodland, CA
| Zip Code | % Employed | vs State | vs National | |
| 1. | 95776 | 1.7% | 2.1%(-0.454)#869 | 1.9%(-0.226)#10,000 |
| 2. | 95695 | 1.4% | 2.1%(-0.678)#974 | 1.9%(-0.451)#11,650 |
1
Common Questions
What are the Top Zip Codes with the Highest Percentage of Population Employed in Real Estate, Rental & Leasing in Woodland, CA?
Top Zip Codes with the Highest Percentage of Population Employed in Real Estate, Rental & Leasing in Woodland, CA are:
What zip code has the Highest Percentage of Population Employed in Real Estate, Rental & Leasing in Woodland, CA?
95776 has the Highest Percentage of Population Employed in Real Estate, Rental & Leasing in Woodland, CA with 1.7%.
What is the Percentage of Population Employed in Real Estate, Rental & Leasing in Woodland, CA?
Percentage of Population Employed in Real Estate, Rental & Leasing in Woodland is 1.6%.
What is the Percentage of Population Employed in Real Estate, Rental & Leasing in California?
Percentage of Population Employed in Real Estate, Rental & Leasing in California is 2.1%.
What is the Percentage of Population Employed in Real Estate, Rental & Leasing in the United States?
Percentage of Population Employed in Real Estate, Rental & Leasing in the United States is 1.9%.