Zip Codes with the Highest Percentage of Population Employed in Food Preparation & Serving in Madera, CA
RELATED REPORTS & OPTIONS
Food Preparation & Serving
Madera
Compare Zip Codes
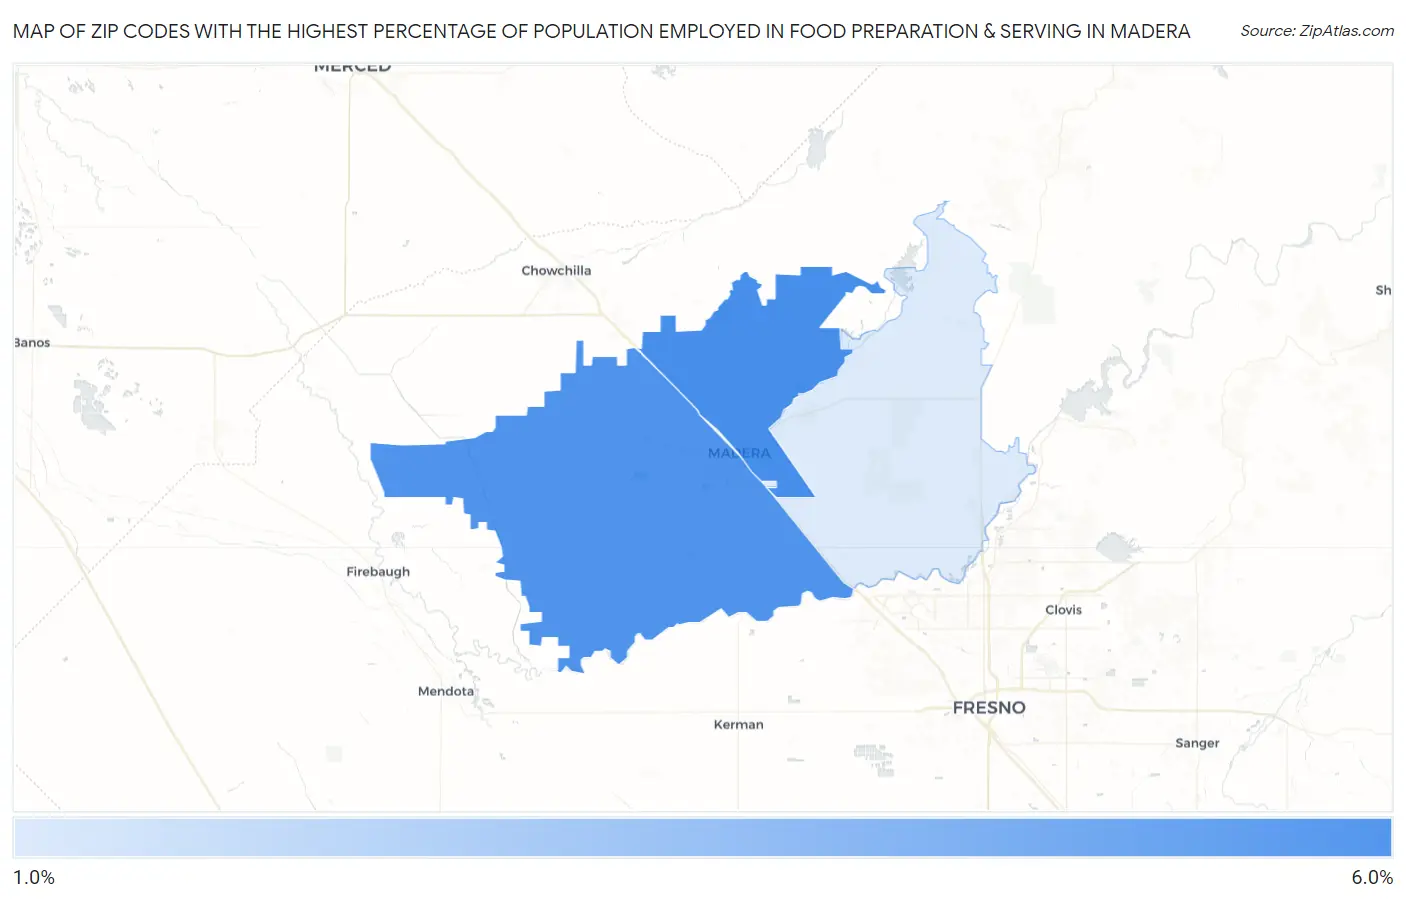
Map of Zip Codes with the Highest Percentage of Population Employed in Food Preparation & Serving in Madera
1.7%
5.1%
Zip Codes with the Highest Percentage of Population Employed in Food Preparation & Serving in Madera, CA
| Zip Code | % Employed | vs State | vs National | |
| 1. | 93638 | 5.1% | 5.4%(-0.295)#762 | 5.3%(-0.199)#12,590 |
| 2. | 93637 | 4.9% | 5.4%(-0.517)#822 | 5.3%(-0.421)#13,497 |
| 3. | 93636 | 1.7% | 5.4%(-3.71)#1,424 | 5.3%(-3.61)#25,587 |
1
Common Questions
What are the Top Zip Codes with the Highest Percentage of Population Employed in Food Preparation & Serving in Madera, CA?
Top Zip Codes with the Highest Percentage of Population Employed in Food Preparation & Serving in Madera, CA are:
What zip code has the Highest Percentage of Population Employed in Food Preparation & Serving in Madera, CA?
93638 has the Highest Percentage of Population Employed in Food Preparation & Serving in Madera, CA with 5.1%.
What is the Percentage of Population Employed in Food Preparation & Serving in Madera, CA?
Percentage of Population Employed in Food Preparation & Serving in Madera is 4.9%.
What is the Percentage of Population Employed in Food Preparation & Serving in California?
Percentage of Population Employed in Food Preparation & Serving in California is 5.4%.
What is the Percentage of Population Employed in Food Preparation & Serving in the United States?
Percentage of Population Employed in Food Preparation & Serving in the United States is 5.3%.