Zip Codes with the Highest Percentage of Population with a Degree in Computers and Mathematics in Little Rock, AR
RELATED REPORTS & OPTIONS
Computers and Mathematics
Little Rock
Compare Zip Codes
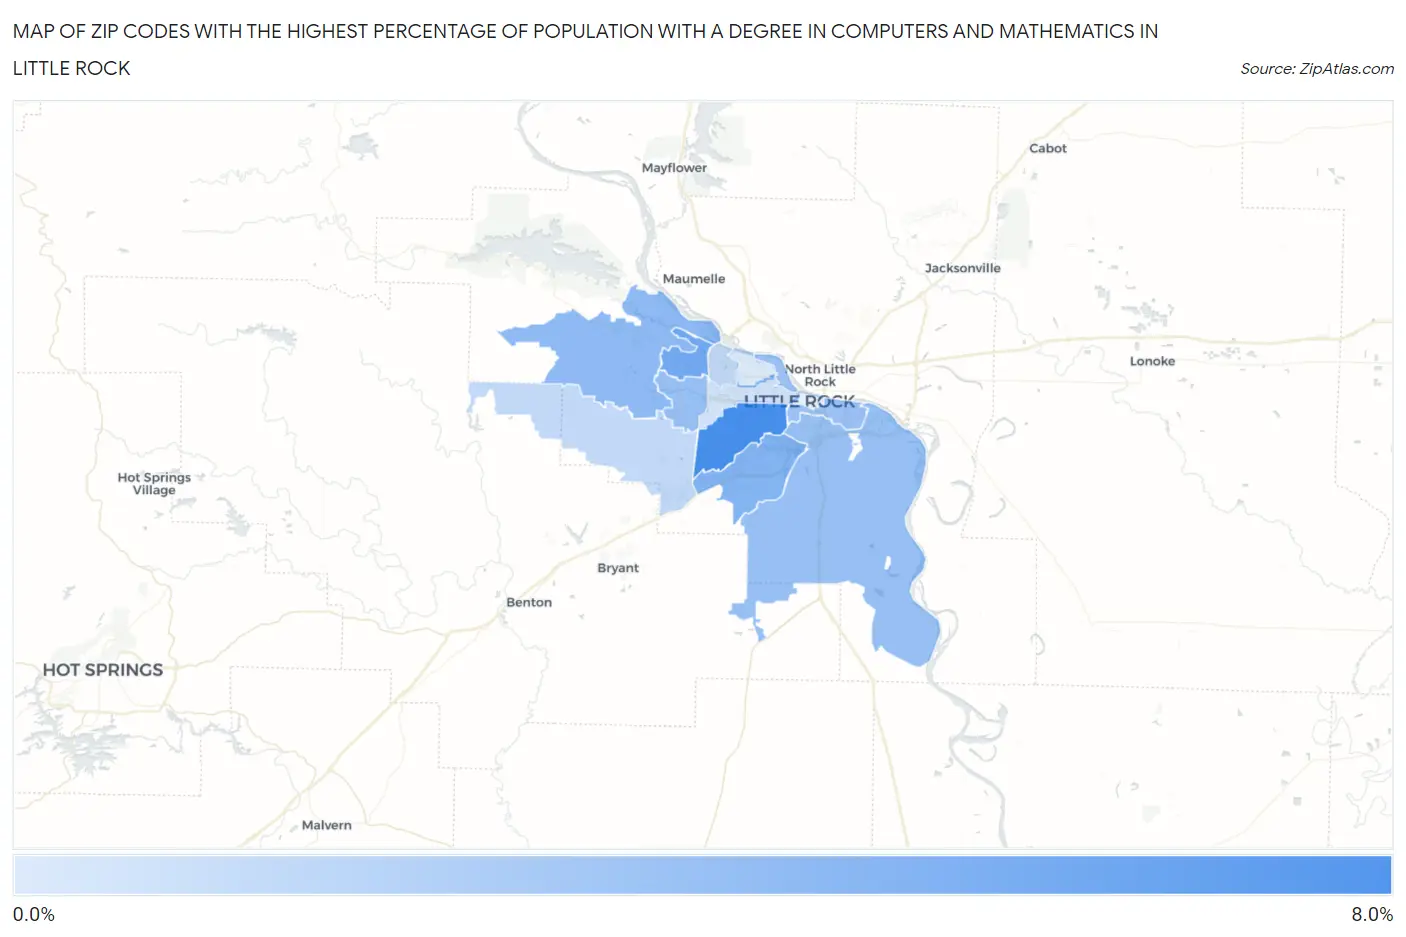
Map of Zip Codes with the Highest Percentage of Population with a Degree in Computers and Mathematics in Little Rock
1.2%
7.7%
Zip Codes with the Highest Percentage of Population with a Degree in Computers and Mathematics in Little Rock, AR
| Zip Code | % Graduates | vs State | vs National | |
| 1. | 72204 | 7.7% | 4.0%(+3.68)#65 | 4.9%(+2.83)#3,115 |
| 2. | 72212 | 5.9% | 4.0%(+1.85)#90 | 4.9%(+0.997)#5,506 |
| 3. | 72209 | 5.1% | 4.0%(+1.06)#100 | 4.9%(+0.199)#7,229 |
| 4. | 72223 | 4.5% | 4.0%(+0.503)#117 | 4.9%(-0.354)#8,745 |
| 5. | 72206 | 4.2% | 4.0%(+0.151)#139 | 4.9%(-0.706)#9,878 |
| 6. | 72211 | 4.1% | 4.0%(+0.111)#141 | 4.9%(-0.746)#9,997 |
| 7. | 72202 | 4.1% | 4.0%(+0.045)#143 | 4.9%(-0.812)#10,196 |
| 8. | 72227 | 2.4% | 4.0%(-1.61)#209 | 4.9%(-2.47)#16,176 |
| 9. | 72210 | 2.4% | 4.0%(-1.62)#211 | 4.9%(-2.48)#16,220 |
| 10. | 72205 | 1.7% | 4.0%(-2.36)#240 | 4.9%(-3.22)#18,599 |
| 11. | 72207 | 1.2% | 4.0%(-2.80)#257 | 4.9%(-3.66)#19,905 |
1
Common Questions
What are the Top 10 Zip Codes with the Highest Percentage of Population with a Degree in Computers and Mathematics in Little Rock, AR?
Top 10 Zip Codes with the Highest Percentage of Population with a Degree in Computers and Mathematics in Little Rock, AR are:
What zip code has the Highest Percentage of Population with a Degree in Computers and Mathematics in Little Rock, AR?
72204 has the Highest Percentage of Population with a Degree in Computers and Mathematics in Little Rock, AR with 7.7%.
What is the Percentage of Population with a Degree in Computers and Mathematics in Little Rock, AR?
Percentage of Population with a Degree in Computers and Mathematics in Little Rock is 3.8%.
What is the Percentage of Population with a Degree in Computers and Mathematics in Arkansas?
Percentage of Population with a Degree in Computers and Mathematics in Arkansas is 4.0%.
What is the Percentage of Population with a Degree in Computers and Mathematics in the United States?
Percentage of Population with a Degree in Computers and Mathematics in the United States is 4.9%.