Zip Codes with the Highest Percentage of Population Employed in Real Estate, Rental & Leasing in Little Rock, AR
RELATED REPORTS & OPTIONS
Real Estate, Rental & Leasing
Little Rock
Compare Zip Codes
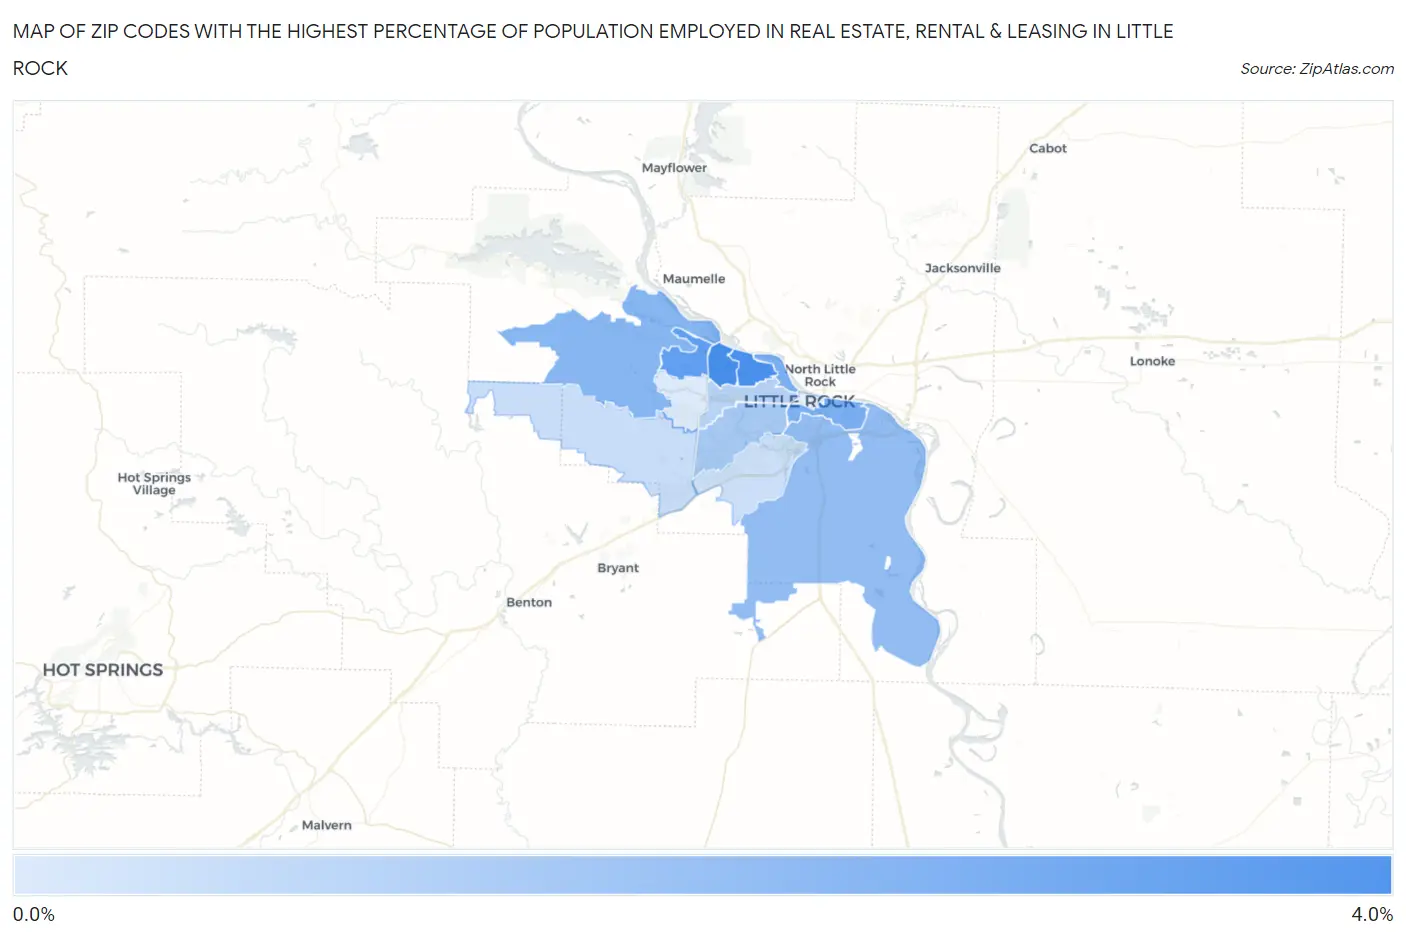
Map of Zip Codes with the Highest Percentage of Population Employed in Real Estate, Rental & Leasing in Little Rock
0.71%
3.0%
Zip Codes with the Highest Percentage of Population Employed in Real Estate, Rental & Leasing in Little Rock, AR
| Zip Code | % Employed | vs State | vs National | |
| 1. | 72227 | 3.0% | 1.4%(+1.64)#44 | 1.9%(+1.13)#3,834 |
| 2. | 72207 | 3.0% | 1.4%(+1.60)#45 | 1.9%(+1.10)#3,938 |
| 3. | 72212 | 2.6% | 1.4%(+1.24)#55 | 1.9%(+0.727)#5,039 |
| 4. | 72202 | 2.2% | 1.4%(+0.816)#75 | 1.9%(+0.307)#6,820 |
| 5. | 72223 | 2.0% | 1.4%(+0.650)#86 | 1.9%(+0.140)#7,676 |
| 6. | 72206 | 1.8% | 1.4%(+0.466)#94 | 1.9%(-0.043)#8,799 |
| 7. | 72204 | 1.5% | 1.4%(+0.132)#121 | 1.9%(-0.377)#11,048 |
| 8. | 72205 | 1.3% | 1.4%(-0.095)#150 | 1.9%(-0.605)#12,823 |
| 9. | 72210 | 1.0% | 1.4%(-0.355)#184 | 1.9%(-0.864)#14,916 |
| 10. | 72209 | 0.94% | 1.4%(-0.439)#194 | 1.9%(-0.949)#15,609 |
| 11. | 72211 | 0.71% | 1.4%(-0.672)#230 | 1.9%(-1.18)#17,402 |
1
Common Questions
What are the Top 10 Zip Codes with the Highest Percentage of Population Employed in Real Estate, Rental & Leasing in Little Rock, AR?
Top 10 Zip Codes with the Highest Percentage of Population Employed in Real Estate, Rental & Leasing in Little Rock, AR are:
What zip code has the Highest Percentage of Population Employed in Real Estate, Rental & Leasing in Little Rock, AR?
72227 has the Highest Percentage of Population Employed in Real Estate, Rental & Leasing in Little Rock, AR with 3.0%.
What is the Percentage of Population Employed in Real Estate, Rental & Leasing in Little Rock, AR?
Percentage of Population Employed in Real Estate, Rental & Leasing in Little Rock is 1.6%.
What is the Percentage of Population Employed in Real Estate, Rental & Leasing in Arkansas?
Percentage of Population Employed in Real Estate, Rental & Leasing in Arkansas is 1.4%.
What is the Percentage of Population Employed in Real Estate, Rental & Leasing in the United States?
Percentage of Population Employed in Real Estate, Rental & Leasing in the United States is 1.9%.