Zip Codes with the Most Immigrants from Asia in Little Rock, AR
RELATED REPORTS & OPTIONS
Asia
Little Rock
Compare Zip Codes
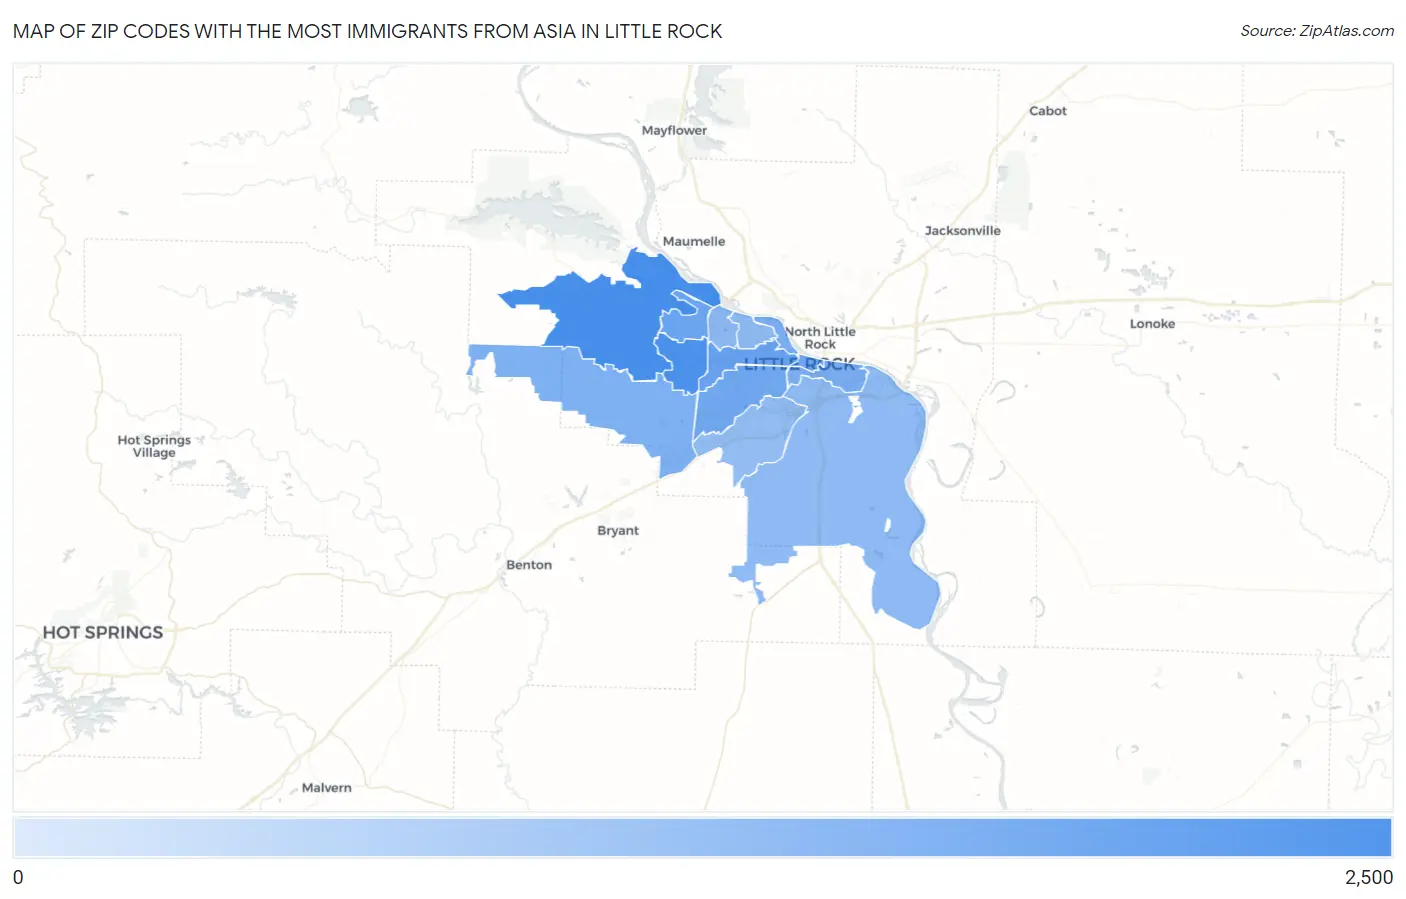
Map of Zip Codes with the Most Immigrants from Asia in Little Rock
41
2,108
Zip Codes with the Most Immigrants from Asia in Little Rock, AR
| Zip Code | Asia | vs State | vs National | |
| 1. | 72223 | 2,108 | 34,203(6.16%)#2 | 14,105,933(0.01%)#1,720 |
| 2. | 72211 | 1,602 | 34,203(4.68%)#4 | 14,105,933(0.01%)#2,181 |
| 3. | 72205 | 401 | 34,203(1.17%)#20 | 14,105,933(0.00%)#5,607 |
| 4. | 72212 | 307 | 34,203(0.90%)#31 | 14,105,933(0.00%)#6,328 |
| 5. | 72201 | 295 | 34,203(0.86%)#32 | 14,105,933(0.00%)#6,428 |
| 6. | 72204 | 244 | 34,203(0.71%)#38 | 14,105,933(0.00%)#6,923 |
| 7. | 72202 | 161 | 34,203(0.47%)#47 | 14,105,933(0.00%)#8,022 |
| 8. | 72210 | 130 | 34,203(0.38%)#51 | 14,105,933(0.00%)#8,564 |
| 9. | 72227 | 59 | 34,203(0.17%)#82 | 14,105,933(0.00%)#10,673 |
| 10. | 72207 | 57 | 34,203(0.17%)#88 | 14,105,933(0.00%)#10,781 |
| 11. | 72206 | 53 | 34,203(0.15%)#91 | 14,105,933(0.00%)#10,964 |
| 12. | 72209 | 41 | 34,203(0.12%)#100 | 14,105,933(0.00%)#11,657 |
1
Common Questions
What are the Top 10 Zip Codes with the Most Immigrants from Asia in Little Rock, AR?
Top 10 Zip Codes with the Most Immigrants from Asia in Little Rock, AR are:
What zip code has the Most Immigrants from Asia in Little Rock, AR?
72223 has the Most Immigrants from Asia in Little Rock, AR with 2,108.
What is the Total Immigrants from Asia in Little Rock, AR?
Total Immigrants from Asia in Little Rock is 5,323.
What is the Total Immigrants from Asia in Arkansas?
Total Immigrants from Asia in Arkansas is 34,203.
What is the Total Immigrants from Asia in the United States?
Total Immigrants from Asia in the United States is 14,105,933.