Zip Codes with the Highest Percentage of Swiss Population in Little Rock, AR
RELATED REPORTS & OPTIONS
Swiss
Little Rock
Compare Zip Codes
Map of Zip Codes with the Highest Percentage of Swiss Population in Little Rock
0.025%
0.68%
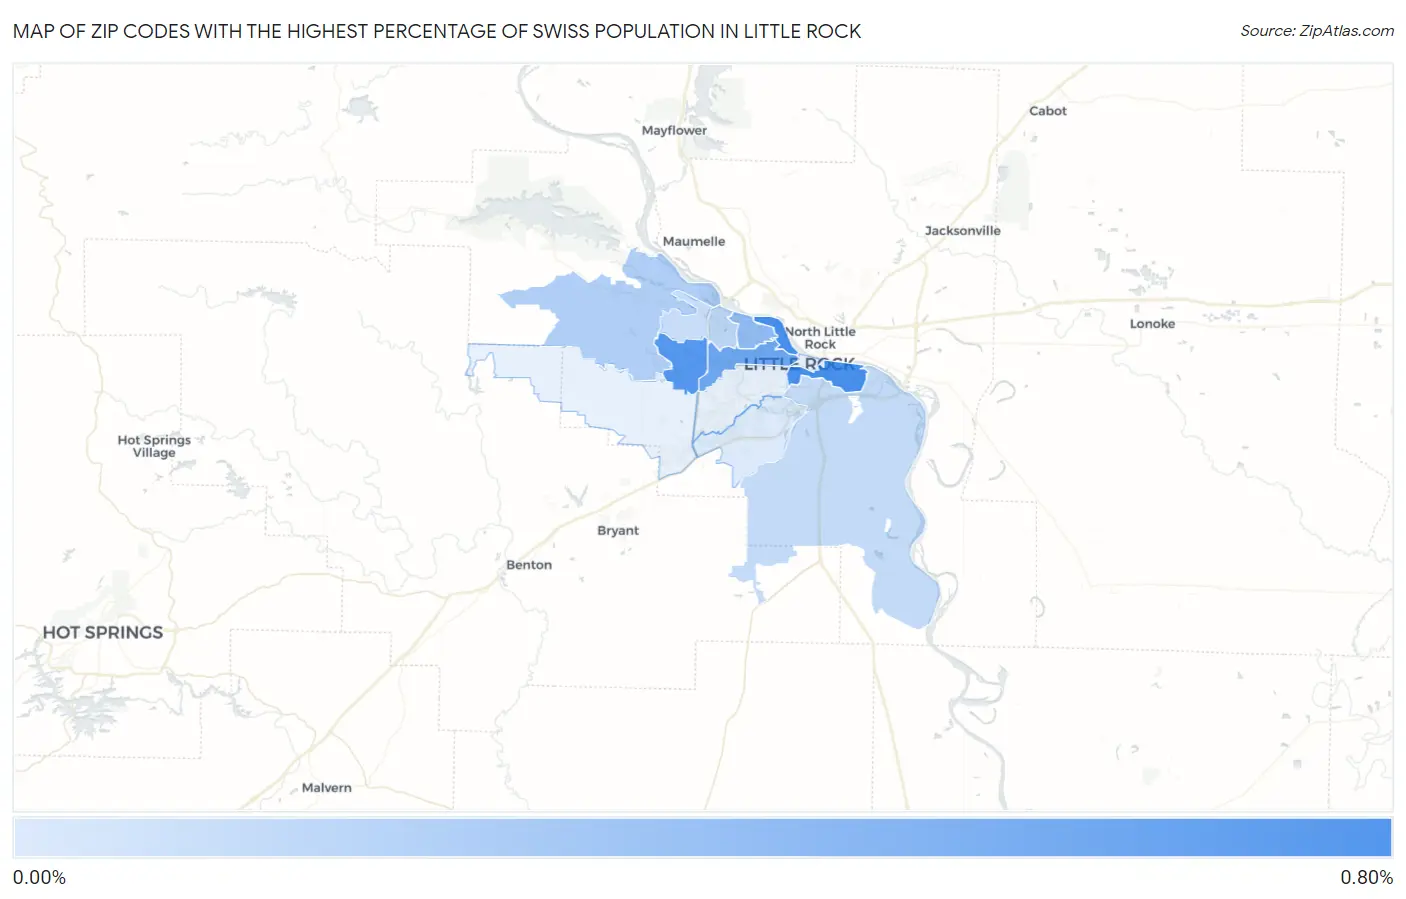
Zip Codes with the Highest Percentage of Swiss Population in Little Rock, AR
| Zip Code | Swiss | vs State | vs National | |
| 1. | 72202 | 0.68% | 0.16%(+0.522)#24 | 0.26%(+0.412)#3,799 |
| 2. | 72211 | 0.61% | 0.16%(+0.457)#29 | 0.26%(+0.348)#4,238 |
| 3. | 72205 | 0.50% | 0.16%(+0.349)#32 | 0.26%(+0.240)#5,108 |
| 4. | 72207 | 0.36% | 0.16%(+0.200)#44 | 0.26%(+0.091)#6,831 |
| 5. | 72223 | 0.21% | 0.16%(+0.059)#68 | 0.26%(-0.050)#9,580 |
| 6. | 72227 | 0.16% | 0.16%(+0.009)#86 | 0.26%(-0.100)#10,892 |
| 7. | 72206 | 0.14% | 0.16%(-0.019)#91 | 0.26%(-0.128)#11,674 |
| 8. | 72212 | 0.12% | 0.16%(-0.038)#97 | 0.26%(-0.147)#12,212 |
| 9. | 72209 | 0.025% | 0.16%(-0.131)#129 | 0.26%(-0.240)#15,180 |
1
Common Questions
What are the Top 10 Zip Codes with the Highest Percentage of Swiss Population in Little Rock, AR?
Top 10 Zip Codes with the Highest Percentage of Swiss Population in Little Rock, AR are:
What zip code has the Highest Percentage of Swiss Population in Little Rock, AR?
72202 has the Highest Percentage of Swiss Population in Little Rock, AR with 0.68%.
What is the Percentage of Swiss Population in Little Rock, AR?
Percentage of Swiss Population in Little Rock is 0.24%.
What is the Percentage of Swiss Population in Arkansas?
Percentage of Swiss Population in Arkansas is 0.16%.
What is the Percentage of Swiss Population in the United States?
Percentage of Swiss Population in the United States is 0.26%.