Zip Codes with the Most Immigrants from Europe in Little Rock, AR

RELATED REPORTS & OPTIONS

Europe
Population
Families and Households
Female Fertility
Female Fertility (Unmarried)
Race (Community Size)
Race (Percentage)
Ancestry (Community Size)
AfricanAmericanApacheArabArgentineanArmenianAssyrian / Chaldean / SyriacAustrianBelgianBhutaneseBlackfeetBritishBurmeseCajunCanadianCelticCentral AmericanCherokeeChileanChoctawColombianCroatianCubanCzechCzechoslovakianDanishDutchEastern EuropeanEgyptianEnglishEuropeanFinnishFrenchFrench CanadianGermanGhanaianGreekGuatemalanGuyaneseHonduranHungarianIndian (Asian)InupiatIranianIrishIroquoisIsraeliItalianJamaicanKoreanLaotianLebaneseLithuanianMalaysianMexicanMexican American IndianMoroccanNative HawaiianNicaraguanNigerianNorthern EuropeanNorwegianOsagePakistaniPanamanianPolishPortuguesePuerto RicanRomanianRussianSalvadoranScandinavianScotch-IrishScottishSiouxSlavicSlovakSouth AmericanSpaniardSpanishSri LankanSubsaharan AfricanSwedishSwissSyrianThaiTrinidadian and TobagonianTurkishUkrainianVenezuelanVietnameseWelshWest IndianYugoslavian
Ancestry (Percentage)
AfricanAmericanApacheArabArgentineanArmenianAssyrian / Chaldean / SyriacAustrianBelgianBhutaneseBlackfeetBritishBurmeseCajunCanadianCelticCentral AmericanCherokeeChileanChoctawColombianCroatianCubanCzechCzechoslovakianDanishDutchEastern EuropeanEgyptianEnglishEuropeanFinnishFrenchFrench CanadianGermanGhanaianGreekGuatemalanGuyaneseHonduranHungarianIndian (Asian)InupiatIranianIrishIroquoisIsraeliItalianJamaicanKoreanLaotianLebaneseLithuanianMalaysianMexicanMexican American IndianMoroccanNative HawaiianNicaraguanNigerianNorthern EuropeanNorwegianOsagePakistaniPanamanianPolishPortuguesePuerto RicanRomanianRussianSalvadoranScandinavianScotch-IrishScottishSiouxSlavicSlovakSouth AmericanSpaniardSpanishSri LankanSubsaharan AfricanSwedishSwissSyrianThaiTrinidadian and TobagonianTurkishUkrainianVenezuelanVietnameseWelshWest IndianYugoslavian
Immigrant Origin (Total)
Immigrant Origin (Percentage)
Income
Income (Families)
Income (Households)
Poverty
Poverty (Families)
Unemployment
Employment Occupations
Employment Industries
Employer Class
Commute Time
Commute Means
School Enrollment
Education by Degree Field
Occupancy
Finances
Physical Characteristics
Little Rock
Compare Zip Codes
Comparison Subject

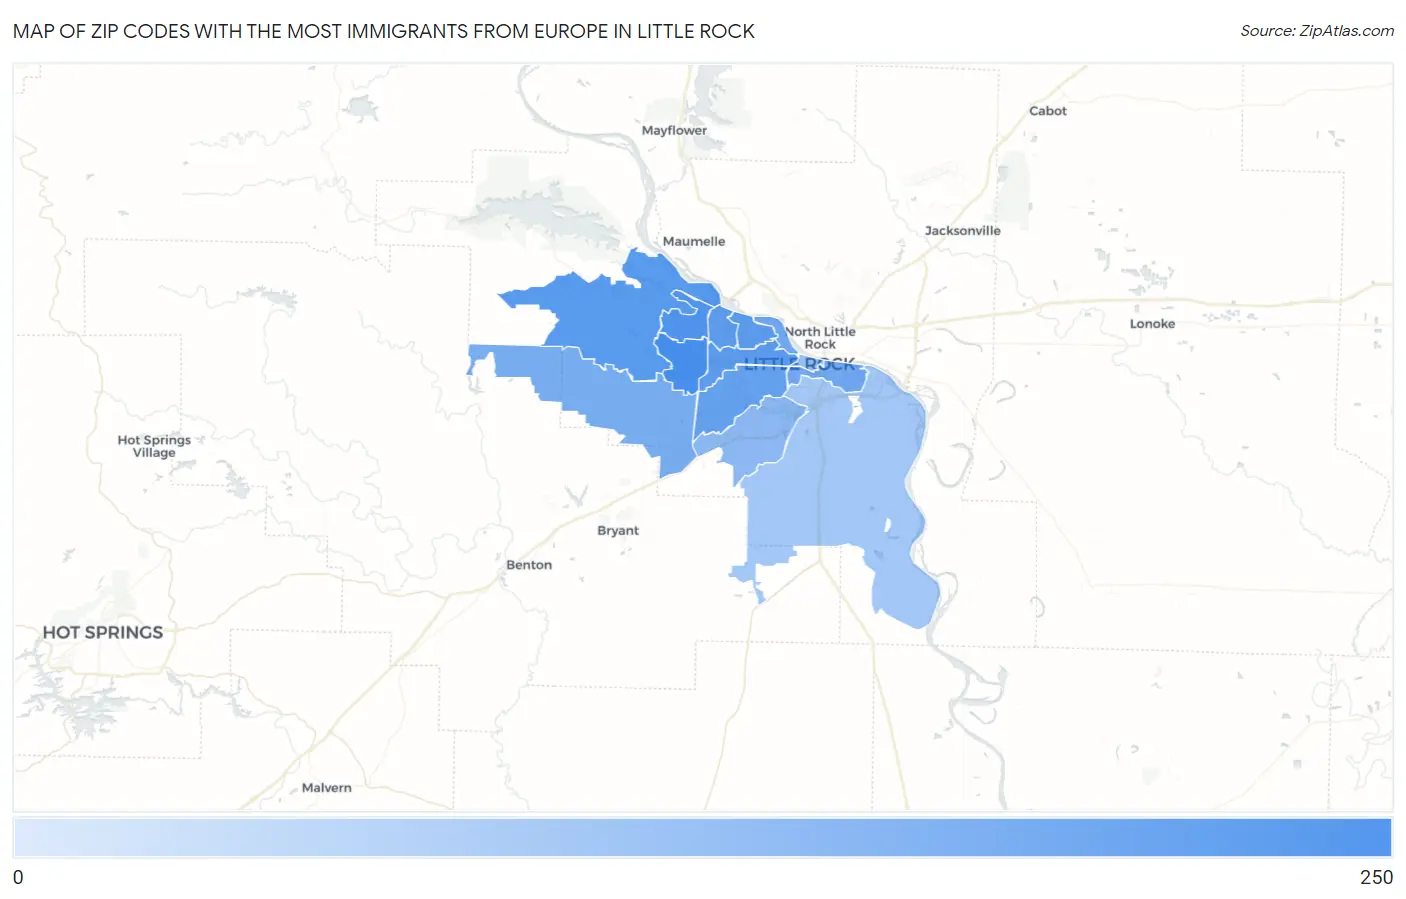
Map of Zip Codes with the Most Immigrants from Europe in Little Rock

0
250
Zip Codes with the Most Immigrants from Europe in Little Rock Map

Zip Codes with the Most Immigrants from Europe in Little Rock, AR

Zip Code Europe vs State vs National
1.7221122210,166(2.18%)#114,820,287(0.00%)#5,310
2.7221218010,166(1.77%)#164,820,287(0.00%)#6,024
3.7222312210,166(1.20%)#224,820,287(0.00%)#7,217
4.7220711310,166(1.11%)#284,820,287(0.00%)#7,475
5.7220510210,166(1.00%)#304,820,287(0.00%)#7,784
6.722279610,166(0.94%)#334,820,287(0.00%)#7,991
7.722047610,166(0.75%)#394,820,287(0.00%)#8,776
8.722024810,166(0.47%)#584,820,287(0.00%)#10,227
9.722103710,166(0.36%)#674,820,287(0.00%)#11,132
10.722091710,166(0.17%)#1134,820,287(0.00%)#13,713
11.722011110,166(0.11%)#1384,820,287(0.00%)#15,345
12.72206710,166(0.07%)#1504,820,287(0.00%)#16,404

Common Questions

What are the Top 10 Zip Codes with the Most Immigrants from Europe in Little Rock, AR?
Top 10 Zip Codes with the Most Immigrants from Europe in Little Rock, AR are:
#1
222
#2
180
#3
122
#4
113
#5
102
#6
96
#7
76
#8
48
#9
37
#10
17
What zip code has the Most Immigrants from Europe in Little Rock, AR?
72211 has the Most Immigrants from Europe in Little Rock, AR with 222.
What is the Total Immigrants from Europe in Little Rock, AR?
Total Immigrants from Europe in Little Rock is 974.
What is the Total Immigrants from Europe in Arkansas?
Total Immigrants from Europe in Arkansas is 10,166.
What is the Total Immigrants from Europe in the United States?
Total Immigrants from Europe in the United States is 4,820,287.