Zip Codes with the Highest Percentage of Population Employed in Office & Administration in Little Rock, AR
RELATED REPORTS & OPTIONS
Office & Administration
Little Rock
Compare Zip Codes
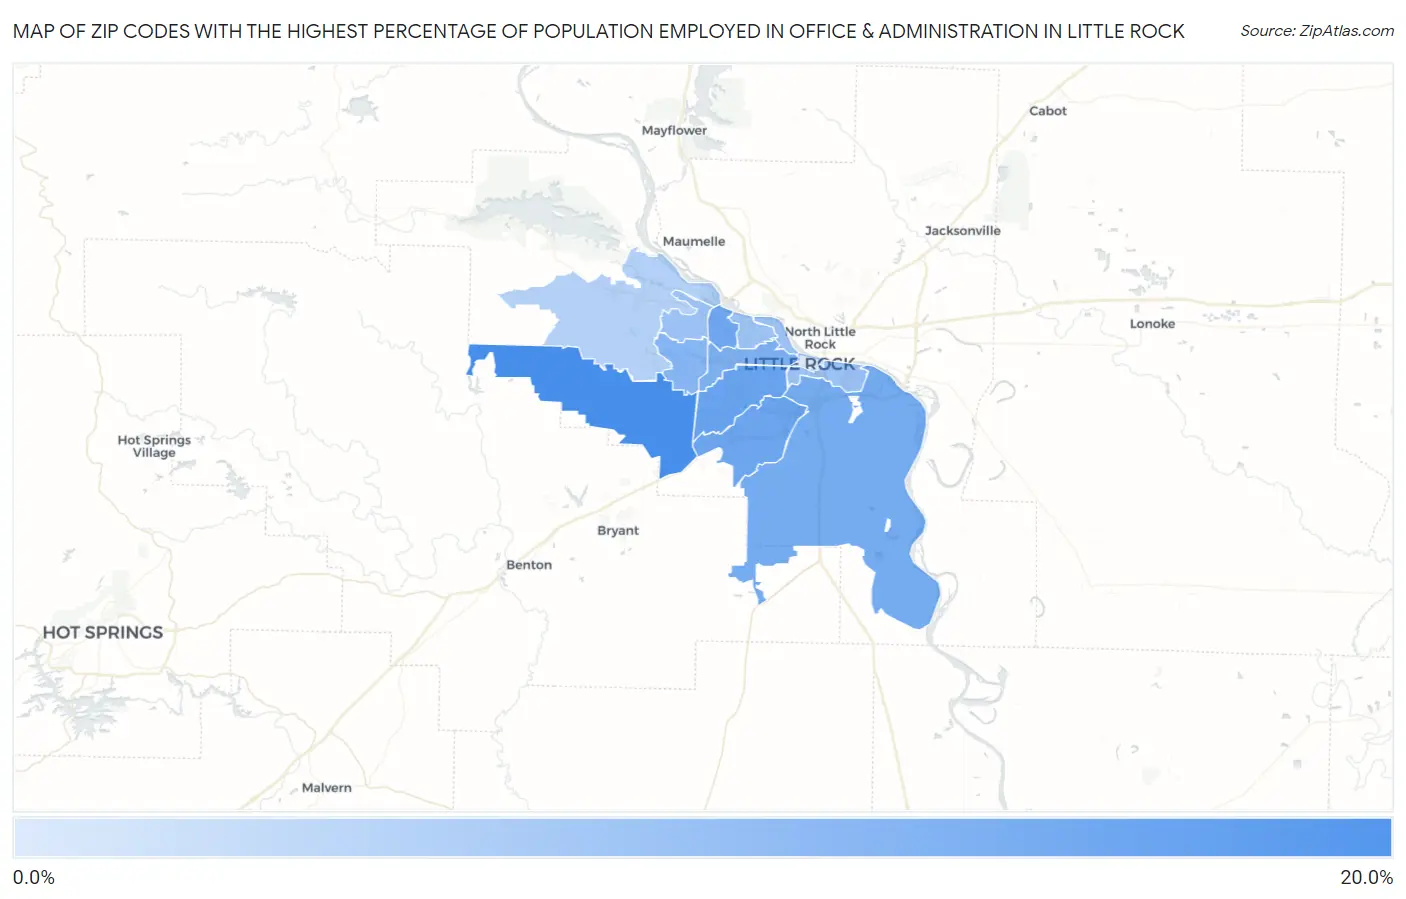
Map of Zip Codes with the Highest Percentage of Population Employed in Office & Administration in Little Rock
1.8%
17.3%
Zip Codes with the Highest Percentage of Population Employed in Office & Administration in Little Rock, AR
| Zip Code | % Employed | vs State | vs National | |
| 1. | 72210 | 17.3% | 10.8%(+6.48)#63 | 10.9%(+6.42)#2,708 |
| 2. | 72204 | 13.5% | 10.8%(+2.76)#123 | 10.9%(+2.69)#6,834 |
| 3. | 72209 | 12.9% | 10.8%(+2.14)#142 | 10.9%(+2.07)#8,229 |
| 4. | 72227 | 12.7% | 10.8%(+1.92)#148 | 10.9%(+1.85)#8,766 |
| 5. | 72206 | 12.4% | 10.8%(+1.59)#161 | 10.9%(+1.52)#9,625 |
| 6. | 72205 | 11.3% | 10.8%(+0.490)#216 | 10.9%(+0.421)#12,954 |
| 7. | 72211 | 10.6% | 10.8%(-0.216)#261 | 10.9%(-0.285)#15,227 |
| 8. | 72212 | 8.5% | 10.8%(-2.34)#355 | 10.9%(-2.41)#21,823 |
| 9. | 72202 | 8.4% | 10.8%(-2.42)#360 | 10.9%(-2.49)#22,047 |
| 10. | 72207 | 8.1% | 10.8%(-2.72)#373 | 10.9%(-2.78)#22,842 |
| 11. | 72223 | 5.8% | 10.8%(-4.95)#433 | 10.9%(-5.02)#27,094 |
| 12. | 72201 | 1.8% | 10.8%(-8.94)#500 | 10.9%(-9.01)#30,155 |
1
Common Questions
What are the Top 10 Zip Codes with the Highest Percentage of Population Employed in Office & Administration in Little Rock, AR?
Top 10 Zip Codes with the Highest Percentage of Population Employed in Office & Administration in Little Rock, AR are:
What zip code has the Highest Percentage of Population Employed in Office & Administration in Little Rock, AR?
72210 has the Highest Percentage of Population Employed in Office & Administration in Little Rock, AR with 17.3%.
What is the Percentage of Population Employed in Office & Administration in Little Rock, AR?
Percentage of Population Employed in Office & Administration in Little Rock is 11.0%.
What is the Percentage of Population Employed in Office & Administration in Arkansas?
Percentage of Population Employed in Office & Administration in Arkansas is 10.8%.
What is the Percentage of Population Employed in Office & Administration in the United States?
Percentage of Population Employed in Office & Administration in the United States is 10.9%.