Zip Codes with the Highest Percentage of Population Employed in Food Preparation & Serving in Little Rock, AR
RELATED REPORTS & OPTIONS
Food Preparation & Serving
Little Rock
Compare Zip Codes
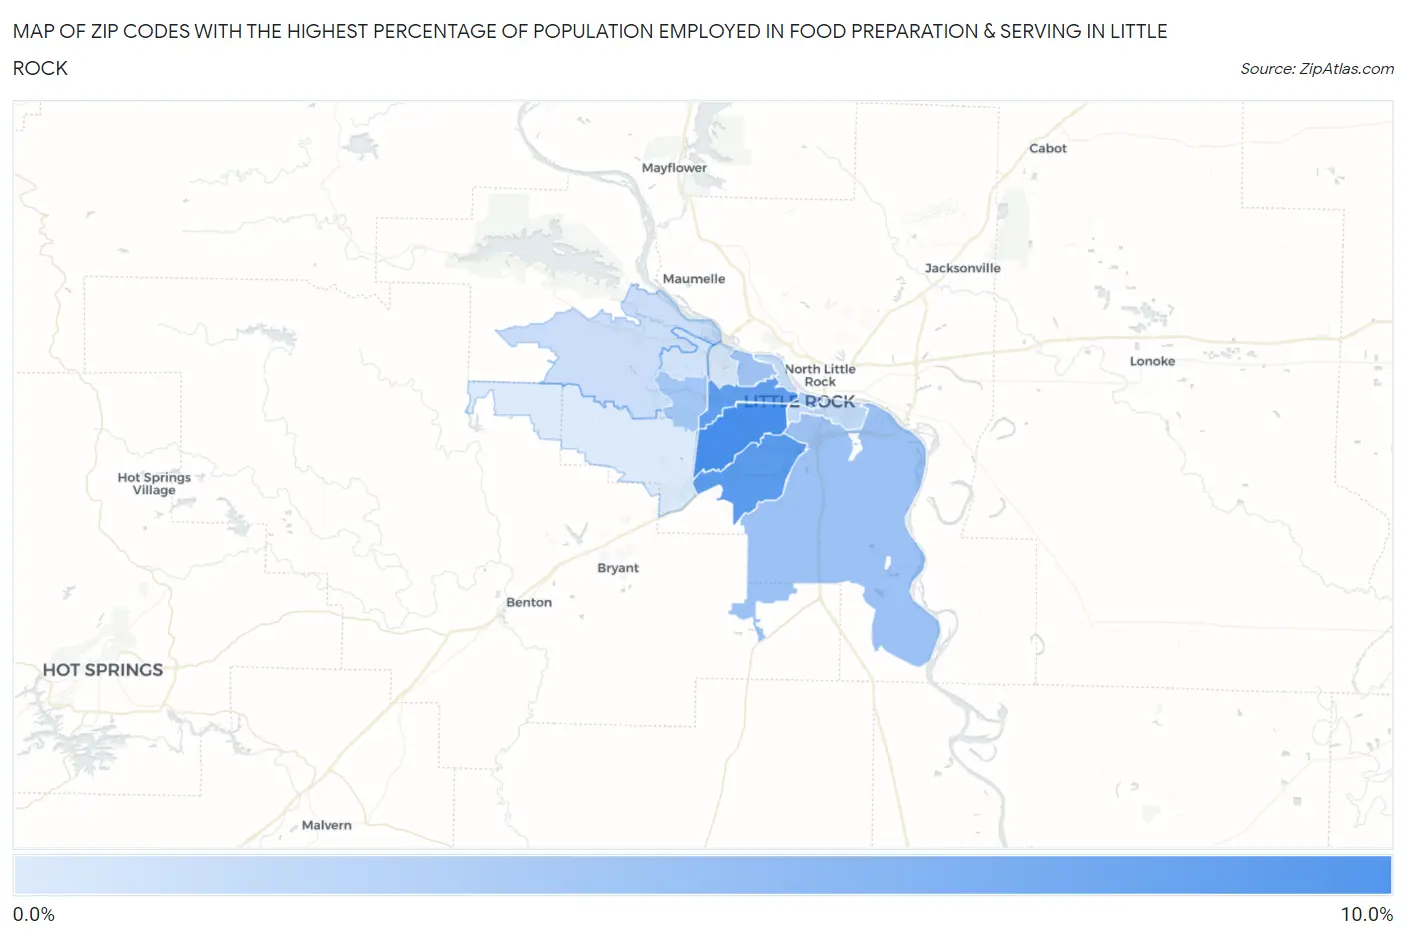
Map of Zip Codes with the Highest Percentage of Population Employed in Food Preparation & Serving in Little Rock
1.9%
8.5%
Zip Codes with the Highest Percentage of Population Employed in Food Preparation & Serving in Little Rock, AR
| Zip Code | % Employed | vs State | vs National | |
| 1. | 72204 | 8.5% | 5.4%(+3.12)#91 | 5.3%(+3.19)#4,094 |
| 2. | 72209 | 7.6% | 5.4%(+2.28)#114 | 5.3%(+2.35)#5,310 |
| 3. | 72205 | 7.4% | 5.4%(+2.01)#122 | 5.3%(+2.09)#5,796 |
| 4. | 72206 | 4.7% | 5.4%(-0.617)#223 | 5.3%(-0.543)#13,974 |
| 5. | 72207 | 4.5% | 5.4%(-0.904)#242 | 5.3%(-0.830)#15,183 |
| 6. | 72211 | 4.3% | 5.4%(-1.01)#247 | 5.3%(-0.938)#15,647 |
| 7. | 72201 | 4.0% | 5.4%(-1.36)#267 | 5.3%(-1.29)#17,131 |
| 8. | 72202 | 3.0% | 5.4%(-2.41)#330 | 5.3%(-2.34)#21,444 |
| 9. | 72223 | 2.6% | 5.4%(-2.73)#347 | 5.3%(-2.65)#22,654 |
| 10. | 72212 | 2.4% | 5.4%(-2.93)#355 | 5.3%(-2.86)#23,390 |
| 11. | 72227 | 2.2% | 5.4%(-3.14)#364 | 5.3%(-3.06)#24,019 |
| 12. | 72210 | 1.9% | 5.4%(-3.47)#379 | 5.3%(-3.40)#25,020 |
1
Common Questions
What are the Top 10 Zip Codes with the Highest Percentage of Population Employed in Food Preparation & Serving in Little Rock, AR?
Top 10 Zip Codes with the Highest Percentage of Population Employed in Food Preparation & Serving in Little Rock, AR are:
What zip code has the Highest Percentage of Population Employed in Food Preparation & Serving in Little Rock, AR?
72204 has the Highest Percentage of Population Employed in Food Preparation & Serving in Little Rock, AR with 8.5%.
What is the Percentage of Population Employed in Food Preparation & Serving in Little Rock, AR?
Percentage of Population Employed in Food Preparation & Serving in Little Rock is 5.2%.
What is the Percentage of Population Employed in Food Preparation & Serving in Arkansas?
Percentage of Population Employed in Food Preparation & Serving in Arkansas is 5.4%.
What is the Percentage of Population Employed in Food Preparation & Serving in the United States?
Percentage of Population Employed in Food Preparation & Serving in the United States is 5.3%.