Zip Codes with the Highest Percentage of Population Employed in Arts, Media & Entertainment in Little Rock, AR
RELATED REPORTS & OPTIONS
Arts, Media & Entertainment
Little Rock
Compare Zip Codes
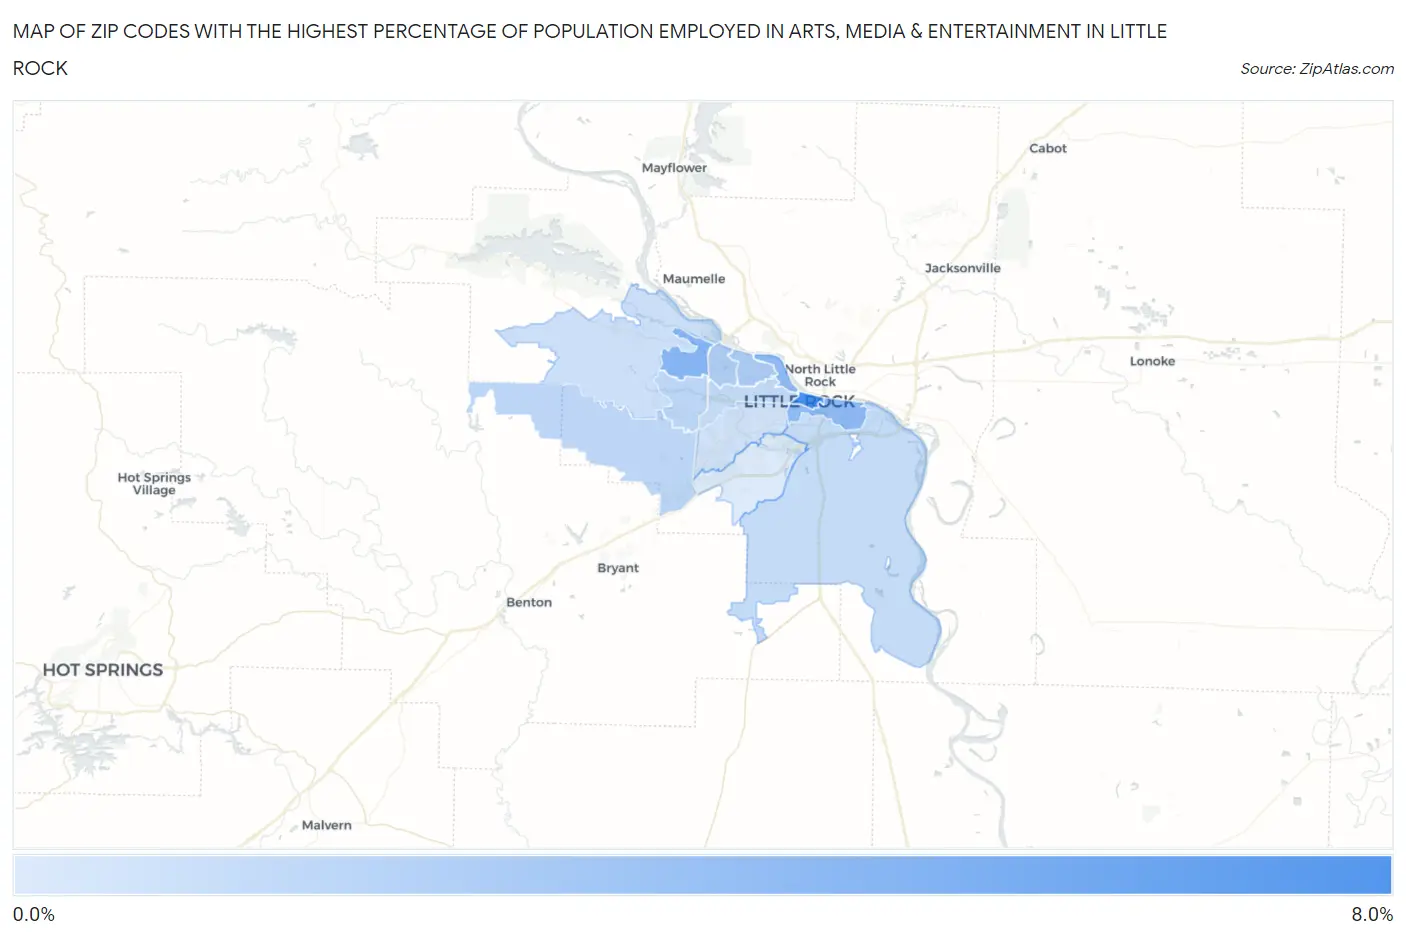
Map of Zip Codes with the Highest Percentage of Population Employed in Arts, Media & Entertainment in Little Rock
0.65%
7.5%
Zip Codes with the Highest Percentage of Population Employed in Arts, Media & Entertainment in Little Rock, AR
| Zip Code | % Employed | vs State | vs National | |
| 1. | 72201 | 7.5% | 1.3%(+6.21)#7 | 2.1%(+5.48)#639 |
| 2. | 72212 | 4.6% | 1.3%(+3.27)#17 | 2.1%(+2.54)#1,781 |
| 3. | 72202 | 4.2% | 1.3%(+2.90)#20 | 2.1%(+2.17)#2,118 |
| 4. | 72207 | 2.9% | 1.3%(+1.55)#35 | 2.1%(+0.813)#4,413 |
| 5. | 72227 | 2.6% | 1.3%(+1.31)#39 | 2.1%(+0.571)#5,128 |
| 6. | 72211 | 2.1% | 1.3%(+0.799)#53 | 2.1%(+0.064)#7,146 |
| 7. | 72210 | 2.1% | 1.3%(+0.773)#55 | 2.1%(+0.039)#7,281 |
| 8. | 72205 | 1.8% | 1.3%(+0.490)#67 | 2.1%(-0.245)#8,893 |
| 9. | 72206 | 1.7% | 1.3%(+0.385)#73 | 2.1%(-0.350)#9,538 |
| 10. | 72223 | 1.3% | 1.3%(+0.009)#101 | 2.1%(-0.726)#12,192 |
| 11. | 72204 | 1.1% | 1.3%(-0.181)#119 | 2.1%(-0.916)#13,632 |
| 12. | 72209 | 0.65% | 1.3%(-0.676)#174 | 2.1%(-1.41)#17,669 |
1
Common Questions
What are the Top 10 Zip Codes with the Highest Percentage of Population Employed in Arts, Media & Entertainment in Little Rock, AR?
Top 10 Zip Codes with the Highest Percentage of Population Employed in Arts, Media & Entertainment in Little Rock, AR are:
What zip code has the Highest Percentage of Population Employed in Arts, Media & Entertainment in Little Rock, AR?
72201 has the Highest Percentage of Population Employed in Arts, Media & Entertainment in Little Rock, AR with 7.5%.
What is the Percentage of Population Employed in Arts, Media & Entertainment in Little Rock, AR?
Percentage of Population Employed in Arts, Media & Entertainment in Little Rock is 2.0%.
What is the Percentage of Population Employed in Arts, Media & Entertainment in Arkansas?
Percentage of Population Employed in Arts, Media & Entertainment in Arkansas is 1.3%.
What is the Percentage of Population Employed in Arts, Media & Entertainment in the United States?
Percentage of Population Employed in Arts, Media & Entertainment in the United States is 2.1%.