Zip Codes with the Lowest Costs of Housing as Percentage of Income in Little Rock, AR

RELATED REPORTS & OPTIONS

Lowest Housing Costs / Income
Population
Families and Households
Female Fertility
Female Fertility (Unmarried)
Race (Community Size)
Race (Percentage)
Ancestry (Community Size)
AfricanAmericanApacheArabArgentineanArmenianAssyrian / Chaldean / SyriacAustrianBelgianBhutaneseBlackfeetBritishBurmeseCajunCanadianCelticCentral AmericanCherokeeChileanChoctawColombianCroatianCubanCzechCzechoslovakianDanishDutchEastern EuropeanEgyptianEnglishEuropeanFinnishFrenchFrench CanadianGermanGhanaianGreekGuatemalanGuyaneseHonduranHungarianIndian (Asian)InupiatIranianIrishIroquoisIsraeliItalianJamaicanKoreanLaotianLebaneseLithuanianMalaysianMexicanMexican American IndianMoroccanNative HawaiianNicaraguanNigerianNorthern EuropeanNorwegianOsagePakistaniPanamanianPolishPortuguesePuerto RicanRomanianRussianSalvadoranScandinavianScotch-IrishScottishSiouxSlavicSlovakSouth AmericanSpaniardSpanishSri LankanSubsaharan AfricanSwedishSwissSyrianThaiTrinidadian and TobagonianTurkishUkrainianVenezuelanVietnameseWelshWest IndianYugoslavian
Ancestry (Percentage)
AfricanAmericanApacheArabArgentineanArmenianAssyrian / Chaldean / SyriacAustrianBelgianBhutaneseBlackfeetBritishBurmeseCajunCanadianCelticCentral AmericanCherokeeChileanChoctawColombianCroatianCubanCzechCzechoslovakianDanishDutchEastern EuropeanEgyptianEnglishEuropeanFinnishFrenchFrench CanadianGermanGhanaianGreekGuatemalanGuyaneseHonduranHungarianIndian (Asian)InupiatIranianIrishIroquoisIsraeliItalianJamaicanKoreanLaotianLebaneseLithuanianMalaysianMexicanMexican American IndianMoroccanNative HawaiianNicaraguanNigerianNorthern EuropeanNorwegianOsagePakistaniPanamanianPolishPortuguesePuerto RicanRomanianRussianSalvadoranScandinavianScotch-IrishScottishSiouxSlavicSlovakSouth AmericanSpaniardSpanishSri LankanSubsaharan AfricanSwedishSwissSyrianThaiTrinidadian and TobagonianTurkishUkrainianVenezuelanVietnameseWelshWest IndianYugoslavian
Immigrant Origin (Total)
Immigrant Origin (Percentage)
Income
Income (Families)
Income (Households)
Poverty
Poverty (Families)
Unemployment
Employment Occupations
Employment Industries
Employer Class
Commute Time
Commute Means
School Enrollment
Education by Degree Field
Occupancy
Finances
Physical Characteristics
Little Rock
Compare Zip Codes
Comparison Subject

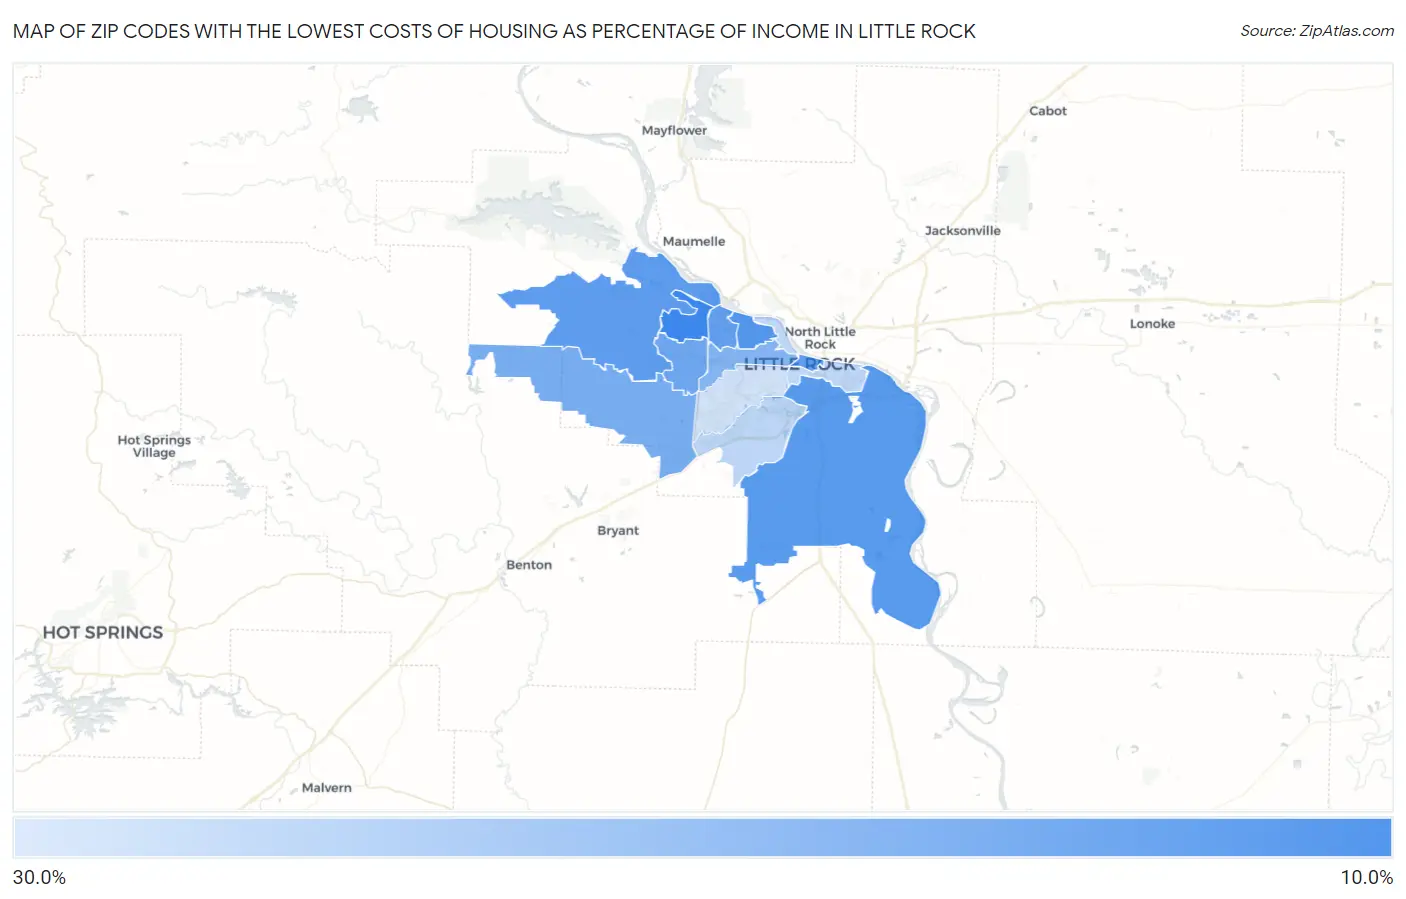
Map of Zip Codes with the Lowest Costs of Housing as Percentage of Income in Little Rock

30.0%
0.0%
Zip Codes with the Lowest Costs of Housing as Percentage of Income in Little Rock Map

Zip Codes with the Lowest Costs of Housing as Percentage of Income in Little Rock, AR

Zip Code Housing Costs / Income vs State vs National
1.7221215.0%17.7%(-2.66)#23620.4%(-5.35)#9,222
2.7220717.0%17.7%(-0.710)#33120.4%(-3.41)#14,313
3.7220617.4%17.7%(-0.293)#35420.4%(-2.99)#15,388
4.7222317.7%17.7%(+0.047)#37220.4%(-2.65)#16,298
5.7220117.9%17.7%(+0.240)#38020.4%(-2.46)#16,769
6.7222718.1%17.7%(+0.410)#38520.4%(-2.29)#17,190
7.7221119.0%17.7%(+1.36)#41620.4%(-1.33)#19,312
8.7221019.7%17.7%(+2.01)#43420.4%(-0.690)#20,668
9.7220520.8%17.7%(+3.16)#46120.4%(+0.464)#22,637
10.7220925.4%17.7%(+7.69)#48720.4%(+4.99)#27,257
11.7220225.8%17.7%(+8.08)#48920.4%(+5.39)#27,503
12.7220427.0%17.7%(+9.35)#49520.4%(+6.65)#28,147

Common Questions

What are the Top 10 Zip Codes with the Lowest Costs of Housing as Percentage of Income in Little Rock, AR?
Top 10 Zip Codes with the Lowest Costs of Housing as Percentage of Income in Little Rock, AR are:
#1
15.0%
#2
17.0%
#3
17.4%
#4
17.7%
#5
17.9%
#6
18.1%
#7
19.0%
#8
19.7%
#9
20.8%
#10
25.4%
What zip code has the Lowest Costs of Housing as Percentage of Income in Little Rock, AR?
72212 has the Lowest Costs of Housing as Percentage of Income in Little Rock, AR with 15.0%.
What is the Average Housing Costs as Percentage of Income in Little Rock, AR?
Average Housing Costs as Percentage of Income in Little Rock is 21.4%.
What is the Average Housing Costs as Percentage of Income in Arkansas?
Average Housing Costs as Percentage of Income in Arkansas is 17.7%.
What is the Average Housing Costs as Percentage of Income in the United States?
Average Housing Costs as Percentage of Income in the United States is 20.4%.