Zip Codes with the Highest Percentage of Population Employed in Community & Social Service in Little Rock, AR
RELATED REPORTS & OPTIONS
Community & Social Service
Little Rock
Compare Zip Codes
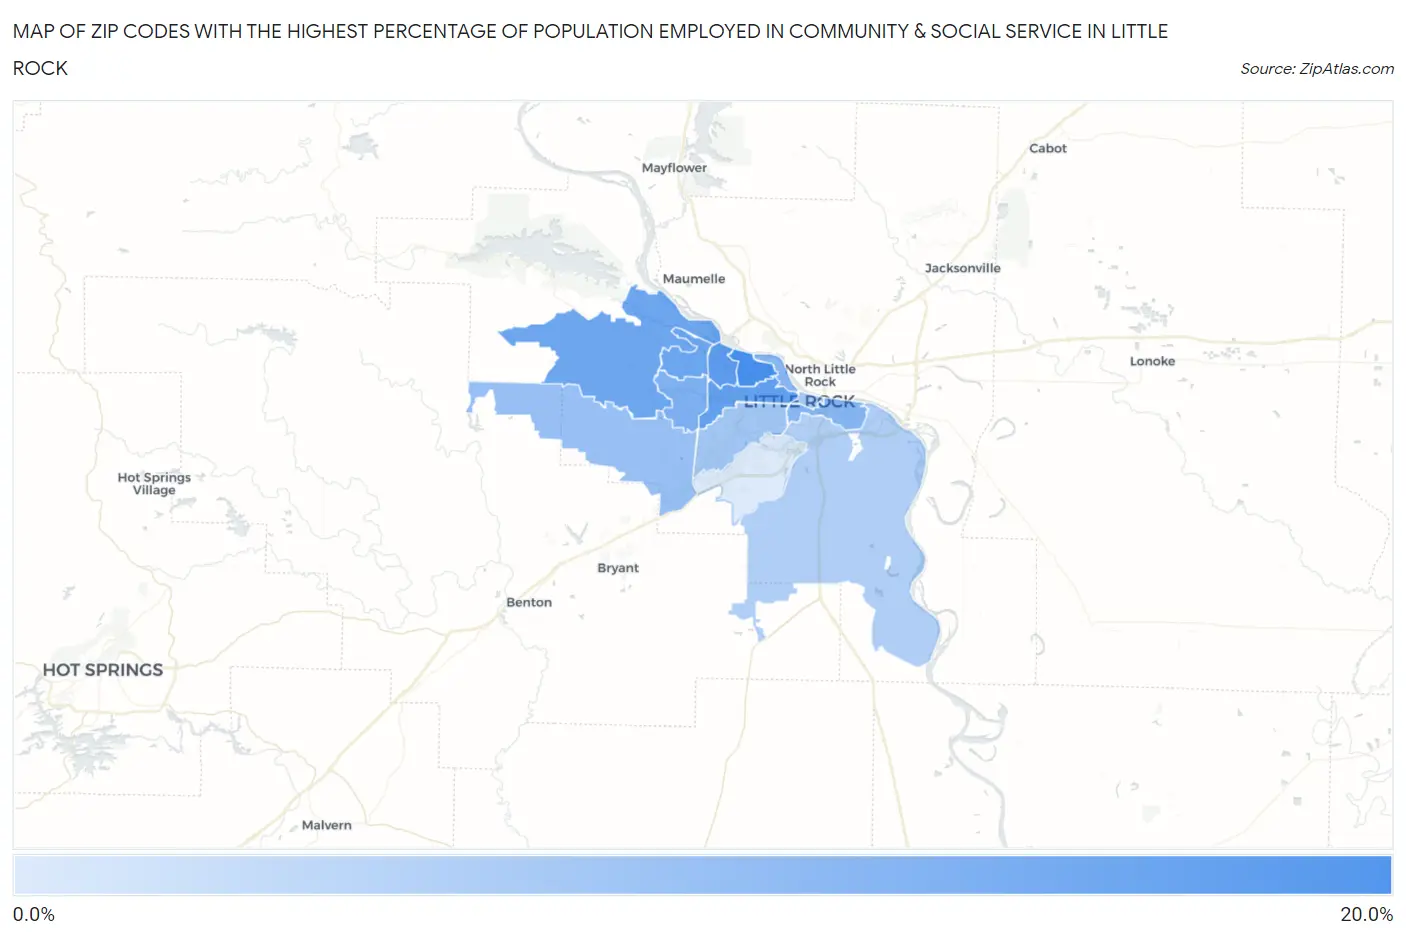
Map of Zip Codes with the Highest Percentage of Population Employed in Community & Social Service in Little Rock
5.2%
19.3%
Zip Codes with the Highest Percentage of Population Employed in Community & Social Service in Little Rock, AR
| Zip Code | % Employed | vs State | vs National | |
| 1. | 72207 | 19.3% | 10.4%(+8.93)#39 | 11.2%(+8.13)#2,259 |
| 2. | 72227 | 17.0% | 10.4%(+6.57)#56 | 11.2%(+5.76)#3,395 |
| 3. | 72205 | 16.5% | 10.4%(+6.13)#61 | 11.2%(+5.32)#3,670 |
| 4. | 72212 | 15.8% | 10.4%(+5.36)#71 | 11.2%(+4.56)#4,273 |
| 5. | 72223 | 15.6% | 10.4%(+5.15)#72 | 11.2%(+4.35)#4,441 |
| 6. | 72211 | 13.8% | 10.4%(+3.40)#95 | 11.2%(+2.59)#6,334 |
| 7. | 72202 | 13.1% | 10.4%(+2.71)#104 | 11.2%(+1.90)#7,365 |
| 8. | 72210 | 11.5% | 10.4%(+1.13)#144 | 11.2%(+0.325)#10,361 |
| 9. | 72204 | 10.5% | 10.4%(+0.082)#178 | 11.2%(-0.721)#12,885 |
| 10. | 72201 | 10.2% | 10.4%(-0.257)#192 | 11.2%(-1.06)#13,732 |
| 11. | 72206 | 9.2% | 10.4%(-1.20)#226 | 11.2%(-2.00)#16,239 |
| 12. | 72209 | 5.2% | 10.4%(-5.26)#384 | 11.2%(-6.06)#25,946 |
1
Common Questions
What are the Top 10 Zip Codes with the Highest Percentage of Population Employed in Community & Social Service in Little Rock, AR?
Top 10 Zip Codes with the Highest Percentage of Population Employed in Community & Social Service in Little Rock, AR are:
What zip code has the Highest Percentage of Population Employed in Community & Social Service in Little Rock, AR?
72207 has the Highest Percentage of Population Employed in Community & Social Service in Little Rock, AR with 19.3%.
What is the Percentage of Population Employed in Community & Social Service in Little Rock, AR?
Percentage of Population Employed in Community & Social Service in Little Rock is 13.0%.
What is the Percentage of Population Employed in Community & Social Service in Arkansas?
Percentage of Population Employed in Community & Social Service in Arkansas is 10.4%.
What is the Percentage of Population Employed in Community & Social Service in the United States?
Percentage of Population Employed in Community & Social Service in the United States is 11.2%.