Zip Codes with the Highest Percentage of Population with a Degree in Liberal Arts and History in Cullman, AL
RELATED REPORTS & OPTIONS
Liberal Arts and History
Cullman
Compare Zip Codes
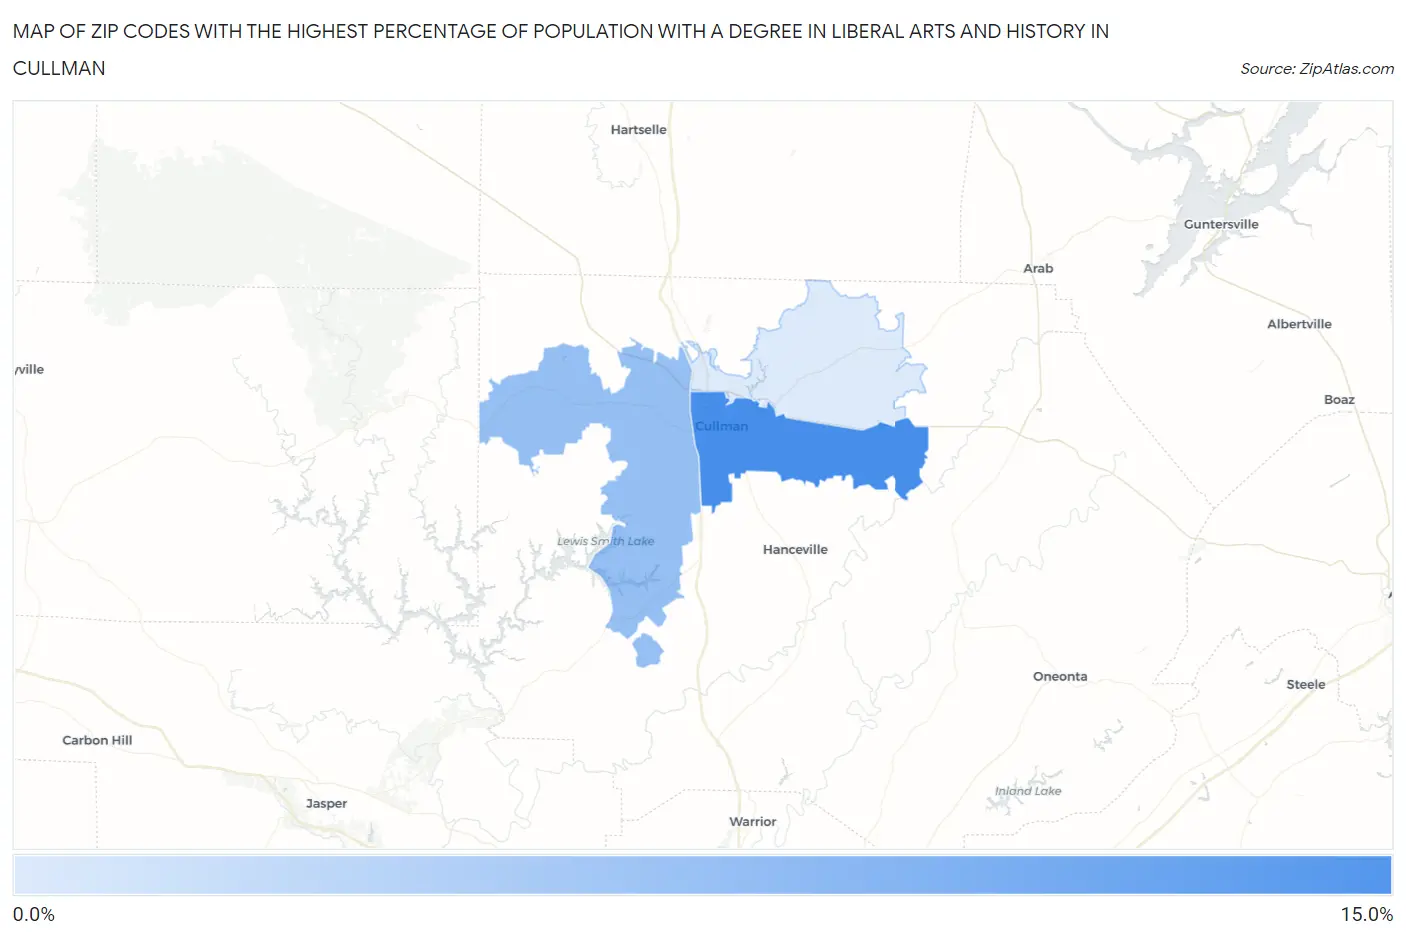
Map of Zip Codes with the Highest Percentage of Population with a Degree in Liberal Arts and History in Cullman
0.35%
10.4%
Zip Codes with the Highest Percentage of Population with a Degree in Liberal Arts and History in Cullman, AL
| Zip Code | % Graduates | vs State | vs National | |
| 1. | 35055 | 10.4% | 4.6%(+5.88)#56 | 4.9%(+5.56)#2,847 |
| 2. | 35057 | 5.0% | 4.6%(+0.435)#225 | 4.9%(+0.114)#11,394 |
| 3. | 35058 | 0.35% | 4.6%(-4.20)#461 | 4.9%(-4.52)#24,126 |
1
Common Questions
What are the Top Zip Codes with the Highest Percentage of Population with a Degree in Liberal Arts and History in Cullman, AL?
Top Zip Codes with the Highest Percentage of Population with a Degree in Liberal Arts and History in Cullman, AL are:
What zip code has the Highest Percentage of Population with a Degree in Liberal Arts and History in Cullman, AL?
35055 has the Highest Percentage of Population with a Degree in Liberal Arts and History in Cullman, AL with 10.4%.
What is the Percentage of Population with a Degree in Liberal Arts and History in Cullman, AL?
Percentage of Population with a Degree in Liberal Arts and History in Cullman is 10.6%.
What is the Percentage of Population with a Degree in Liberal Arts and History in Alabama?
Percentage of Population with a Degree in Liberal Arts and History in Alabama is 4.6%.
What is the Percentage of Population with a Degree in Liberal Arts and History in the United States?
Percentage of Population with a Degree in Liberal Arts and History in the United States is 4.9%.