Zip Codes with the Highest Percentage of Population Employed in Arts, Entertainment & Recreation in Birmingham, AL
RELATED REPORTS & OPTIONS
Arts, Entertainment & Recreation
Birmingham
Compare Zip Codes
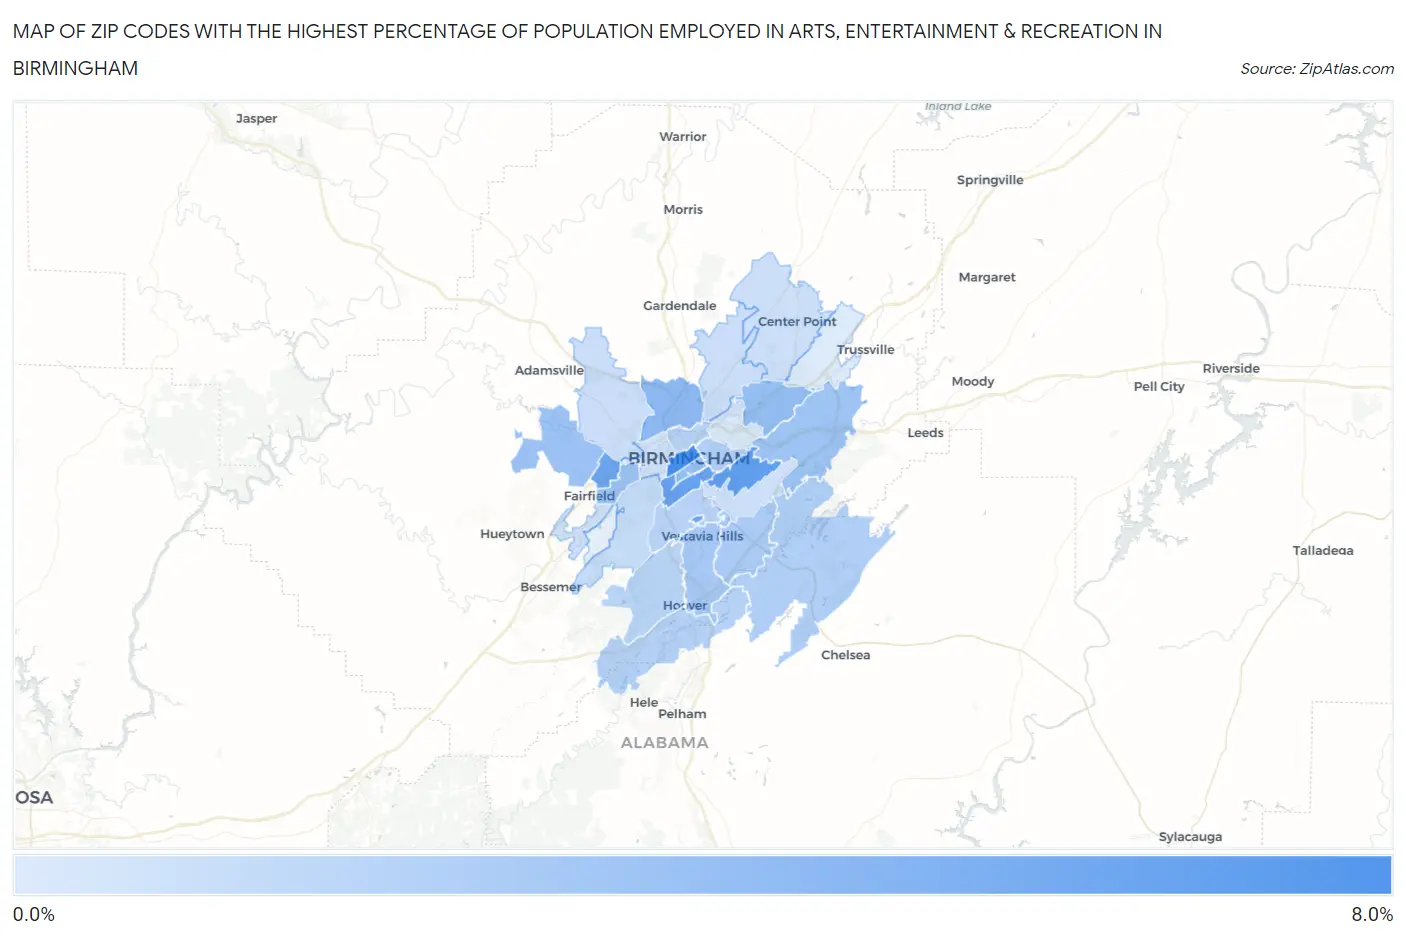
Map of Zip Codes with the Highest Percentage of Population Employed in Arts, Entertainment & Recreation in Birmingham
0.0%
8.0%
Zip Codes with the Highest Percentage of Population Employed in Arts, Entertainment & Recreation in Birmingham, AL
| Zip Code | % Employed | vs State | vs National | |
| 1. | 35203 | 6.0% | 1.4%(+4.66)#21 | 2.1%(+3.94)#1,688 |
| 2. | 35213 | 5.0% | 1.4%(+3.64)#25 | 2.1%(+2.92)#2,281 |
| 3. | 35205 | 4.8% | 1.4%(+3.41)#26 | 2.1%(+2.70)#2,456 |
| 4. | 35229 | 4.6% | 1.4%(+3.24)#27 | 2.1%(+2.53)#2,621 |
| 5. | 35218 | 4.5% | 1.4%(+3.15)#29 | 2.1%(+2.43)#2,718 |
| 6. | 35254 | 3.6% | 1.4%(+2.19)#41 | 2.1%(+1.47)#4,025 |
| 7. | 35207 | 3.2% | 1.4%(+1.88)#47 | 2.1%(+1.17)#4,682 |
| 8. | 35206 | 2.9% | 1.4%(+1.58)#58 | 2.1%(+0.866)#5,509 |
| 9. | 35233 | 2.9% | 1.4%(+1.53)#59 | 2.1%(+0.810)#5,671 |
| 10. | 35208 | 2.7% | 1.4%(+1.36)#65 | 2.1%(+0.646)#6,256 |
| 11. | 35224 | 2.7% | 1.4%(+1.30)#68 | 2.1%(+0.587)#6,486 |
| 12. | 35210 | 2.5% | 1.4%(+1.16)#77 | 2.1%(+0.442)#7,070 |
| 13. | 35216 | 2.3% | 1.4%(+0.908)#92 | 2.1%(+0.193)#8,247 |
| 14. | 35243 | 2.1% | 1.4%(+0.711)#100 | 2.1%(-0.005)#9,330 |
| 15. | 35222 | 1.8% | 1.4%(+0.476)#119 | 2.1%(-0.240)#10,731 |
| 16. | 35242 | 1.8% | 1.4%(+0.438)#131 | 2.1%(-0.277)#10,981 |
| 17. | 35244 | 1.7% | 1.4%(+0.295)#137 | 2.1%(-0.421)#12,001 |
| 18. | 35234 | 1.5% | 1.4%(+0.178)#151 | 2.1%(-0.537)#12,907 |
| 19. | 35209 | 1.5% | 1.4%(+0.173)#153 | 2.1%(-0.543)#12,957 |
| 20. | 35226 | 1.5% | 1.4%(+0.138)#157 | 2.1%(-0.577)#13,208 |
| 21. | 35211 | 1.0% | 1.4%(-0.348)#224 | 2.1%(-1.06)#16,817 |
| 22. | 35214 | 0.91% | 1.4%(-0.459)#241 | 2.1%(-1.17)#17,630 |
| 23. | 35217 | 0.85% | 1.4%(-0.520)#250 | 2.1%(-1.24)#18,078 |
| 24. | 35215 | 0.82% | 1.4%(-0.549)#258 | 2.1%(-1.26)#18,272 |
| 25. | 35223 | 0.80% | 1.4%(-0.563)#261 | 2.1%(-1.28)#18,377 |
| 26. | 35228 | 0.59% | 1.4%(-0.778)#301 | 2.1%(-1.49)#19,907 |
| 27. | 35204 | 0.57% | 1.4%(-0.794)#304 | 2.1%(-1.51)#20,010 |
| 28. | 35212 | 0.30% | 1.4%(-1.07)#356 | 2.1%(-1.78)#21,726 |
| 29. | 35235 | 0.17% | 1.4%(-1.20)#374 | 2.1%(-1.92)#22,333 |
1
Common Questions
What are the Top 10 Zip Codes with the Highest Percentage of Population Employed in Arts, Entertainment & Recreation in Birmingham, AL?
Top 10 Zip Codes with the Highest Percentage of Population Employed in Arts, Entertainment & Recreation in Birmingham, AL are:
What zip code has the Highest Percentage of Population Employed in Arts, Entertainment & Recreation in Birmingham, AL?
35203 has the Highest Percentage of Population Employed in Arts, Entertainment & Recreation in Birmingham, AL with 6.0%.
What is the Percentage of Population Employed in Arts, Entertainment & Recreation in Birmingham, AL?
Percentage of Population Employed in Arts, Entertainment & Recreation in Birmingham is 1.9%.
What is the Percentage of Population Employed in Arts, Entertainment & Recreation in Alabama?
Percentage of Population Employed in Arts, Entertainment & Recreation in Alabama is 1.4%.
What is the Percentage of Population Employed in Arts, Entertainment & Recreation in the United States?
Percentage of Population Employed in Arts, Entertainment & Recreation in the United States is 2.1%.