Zip Codes with the Highest Percentage of Population Employed in Agriculture, Fishing & Hunting in Durham, NC
RELATED REPORTS & OPTIONS
Agriculture, Fishing & Hunting
Durham
Compare Zip Codes
Map of Zip Codes with the Highest Percentage of Population Employed in Agriculture, Fishing & Hunting in Durham
0.056%
0.86%
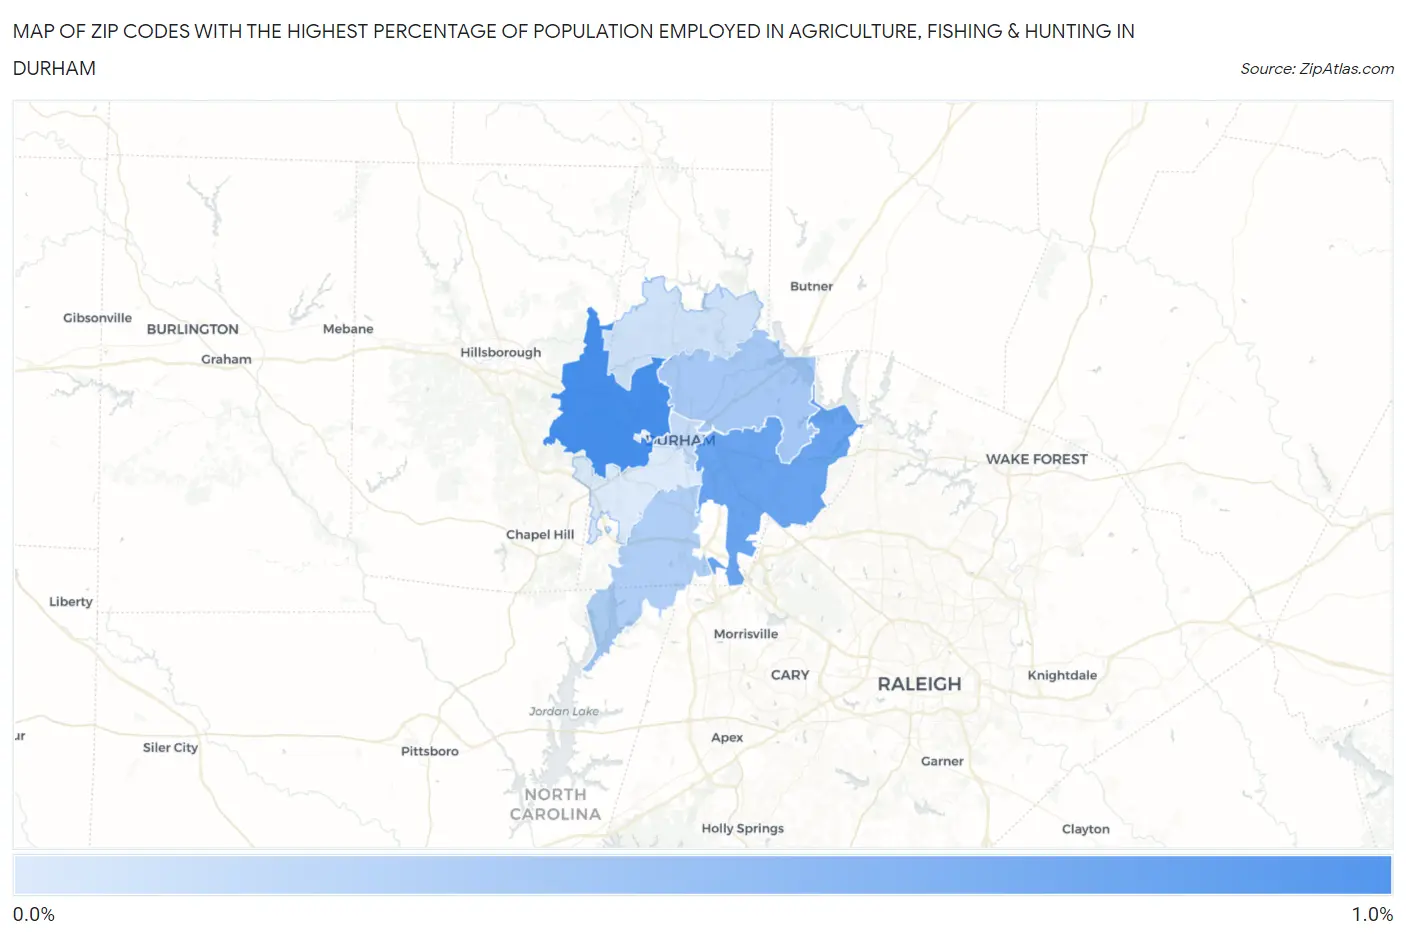
Zip Codes with the Highest Percentage of Population Employed in Agriculture, Fishing & Hunting in Durham, NC
| Zip Code | % Employed | vs State | vs National | |
| 1. | 27705 | 0.86% | 1.0%(-0.148)#411 | 1.2%(-0.339)#16,919 |
| 2. | 27703 | 0.68% | 1.0%(-0.331)#439 | 1.2%(-0.522)#17,974 |
| 3. | 27704 | 0.35% | 1.0%(-0.656)#525 | 1.2%(-0.847)#20,624 |
| 4. | 27713 | 0.29% | 1.0%(-0.717)#550 | 1.2%(-0.908)#21,263 |
| 5. | 27701 | 0.19% | 1.0%(-0.817)#591 | 1.2%(-1.01)#22,471 |
| 6. | 27712 | 0.13% | 1.0%(-0.882)#613 | 1.2%(-1.07)#23,320 |
| 7. | 27707 | 0.056% | 1.0%(-0.952)#640 | 1.2%(-1.14)#24,271 |
1
Common Questions
What are the Top 5 Zip Codes with the Highest Percentage of Population Employed in Agriculture, Fishing & Hunting in Durham, NC?
Top 5 Zip Codes with the Highest Percentage of Population Employed in Agriculture, Fishing & Hunting in Durham, NC are:
What zip code has the Highest Percentage of Population Employed in Agriculture, Fishing & Hunting in Durham, NC?
27705 has the Highest Percentage of Population Employed in Agriculture, Fishing & Hunting in Durham, NC with 0.86%.
What is the Percentage of Population Employed in Agriculture, Fishing & Hunting in Durham, NC?
Percentage of Population Employed in Agriculture, Fishing & Hunting in Durham is 0.27%.
What is the Percentage of Population Employed in Agriculture, Fishing & Hunting in North Carolina?
Percentage of Population Employed in Agriculture, Fishing & Hunting in North Carolina is 1.0%.
What is the Percentage of Population Employed in Agriculture, Fishing & Hunting in the United States?
Percentage of Population Employed in Agriculture, Fishing & Hunting in the United States is 1.2%.