Zip Codes with the Highest Percentage of Population Employed in Business & Financial in Wilmington, DE
RELATED REPORTS & OPTIONS
Business & Financial
Wilmington
Compare Zip Codes
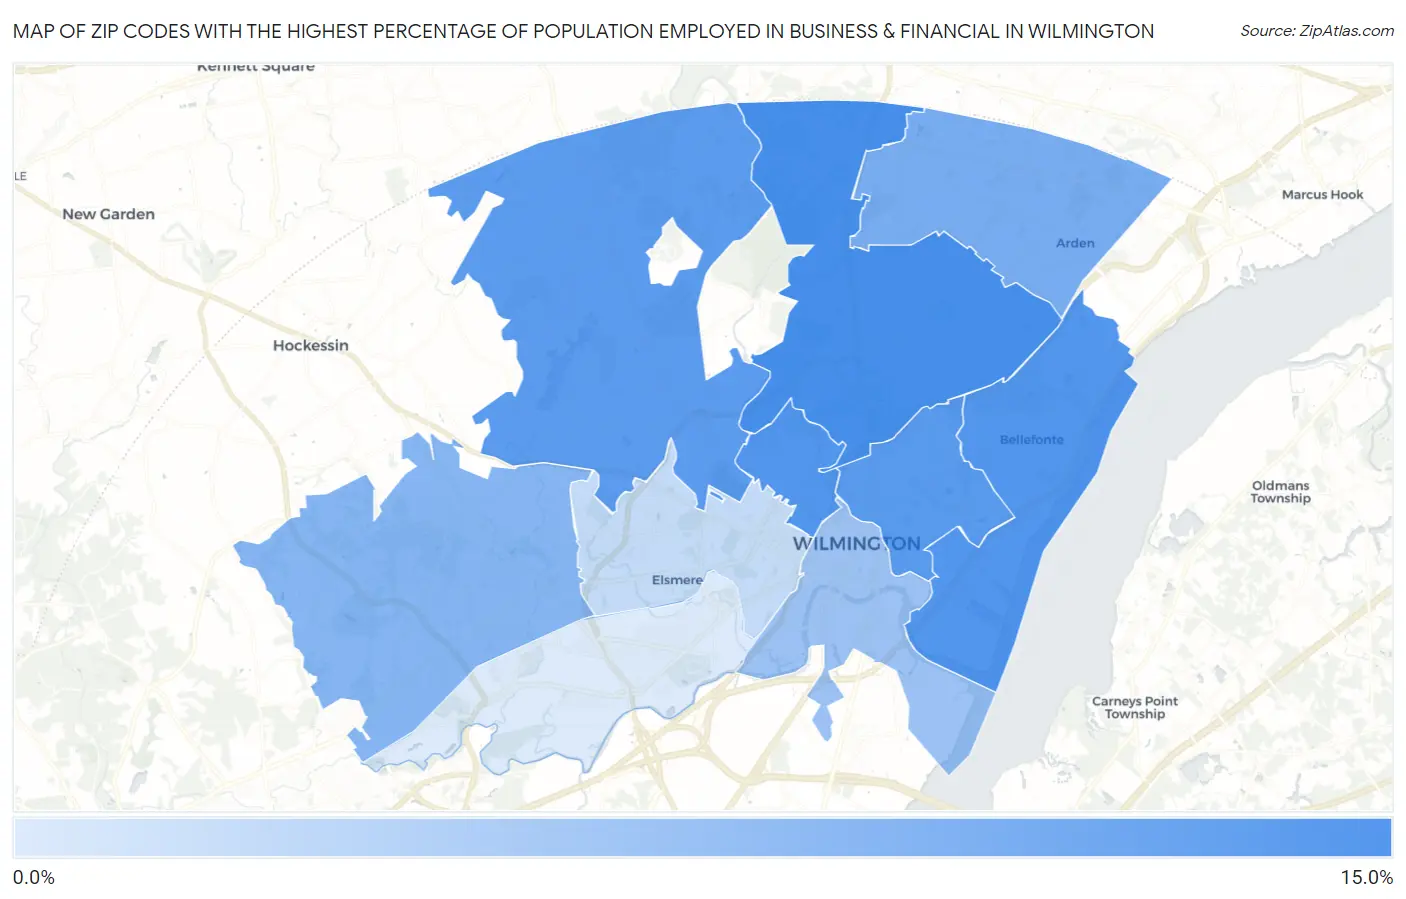
Map of Zip Codes with the Highest Percentage of Population Employed in Business & Financial in Wilmington
3.8%
10.2%
Zip Codes with the Highest Percentage of Population Employed in Business & Financial in Wilmington, DE
| Zip Code | % Employed | vs State | vs National | |
| 1. | 19803 | 10.2% | 6.1%(+4.12)#5 | 5.8%(+4.44)#2,068 |
| 2. | 19809 | 9.7% | 6.1%(+3.63)#7 | 5.8%(+3.95)#2,417 |
| 3. | 19806 | 9.7% | 6.1%(+3.57)#8 | 5.8%(+3.89)#2,482 |
| 4. | 19802 | 9.5% | 6.1%(+3.42)#9 | 5.8%(+3.74)#2,624 |
| 5. | 19807 | 9.4% | 6.1%(+3.31)#10 | 5.8%(+3.63)#2,726 |
| 6. | 19810 | 8.1% | 6.1%(+1.99)#13 | 5.8%(+2.31)#4,157 |
| 7. | 19808 | 7.5% | 6.1%(+1.40)#16 | 5.8%(+1.72)#4,988 |
| 8. | 19801 | 6.6% | 6.1%(+0.537)#20 | 5.8%(+0.857)#6,523 |
| 9. | 19805 | 4.9% | 6.1%(-1.20)#34 | 5.8%(-0.882)#10,805 |
| 10. | 19804 | 3.8% | 6.1%(-2.24)#40 | 5.8%(-1.92)#14,433 |
1
Common Questions
What are the Top 5 Zip Codes with the Highest Percentage of Population Employed in Business & Financial in Wilmington, DE?
Top 5 Zip Codes with the Highest Percentage of Population Employed in Business & Financial in Wilmington, DE are:
What zip code has the Highest Percentage of Population Employed in Business & Financial in Wilmington, DE?
19803 has the Highest Percentage of Population Employed in Business & Financial in Wilmington, DE with 10.2%.
What is the Percentage of Population Employed in Business & Financial in Wilmington, DE?
Percentage of Population Employed in Business & Financial in Wilmington is 8.1%.
What is the Percentage of Population Employed in Business & Financial in Delaware?
Percentage of Population Employed in Business & Financial in Delaware is 6.1%.
What is the Percentage of Population Employed in Business & Financial in the United States?
Percentage of Population Employed in Business & Financial in the United States is 5.8%.