Zip Codes with the Highest Percentage of Hispanic or Latino Population in Wilmington, DE
RELATED REPORTS & OPTIONS
Hispanic or Latino
Wilmington
Compare Zip Codes
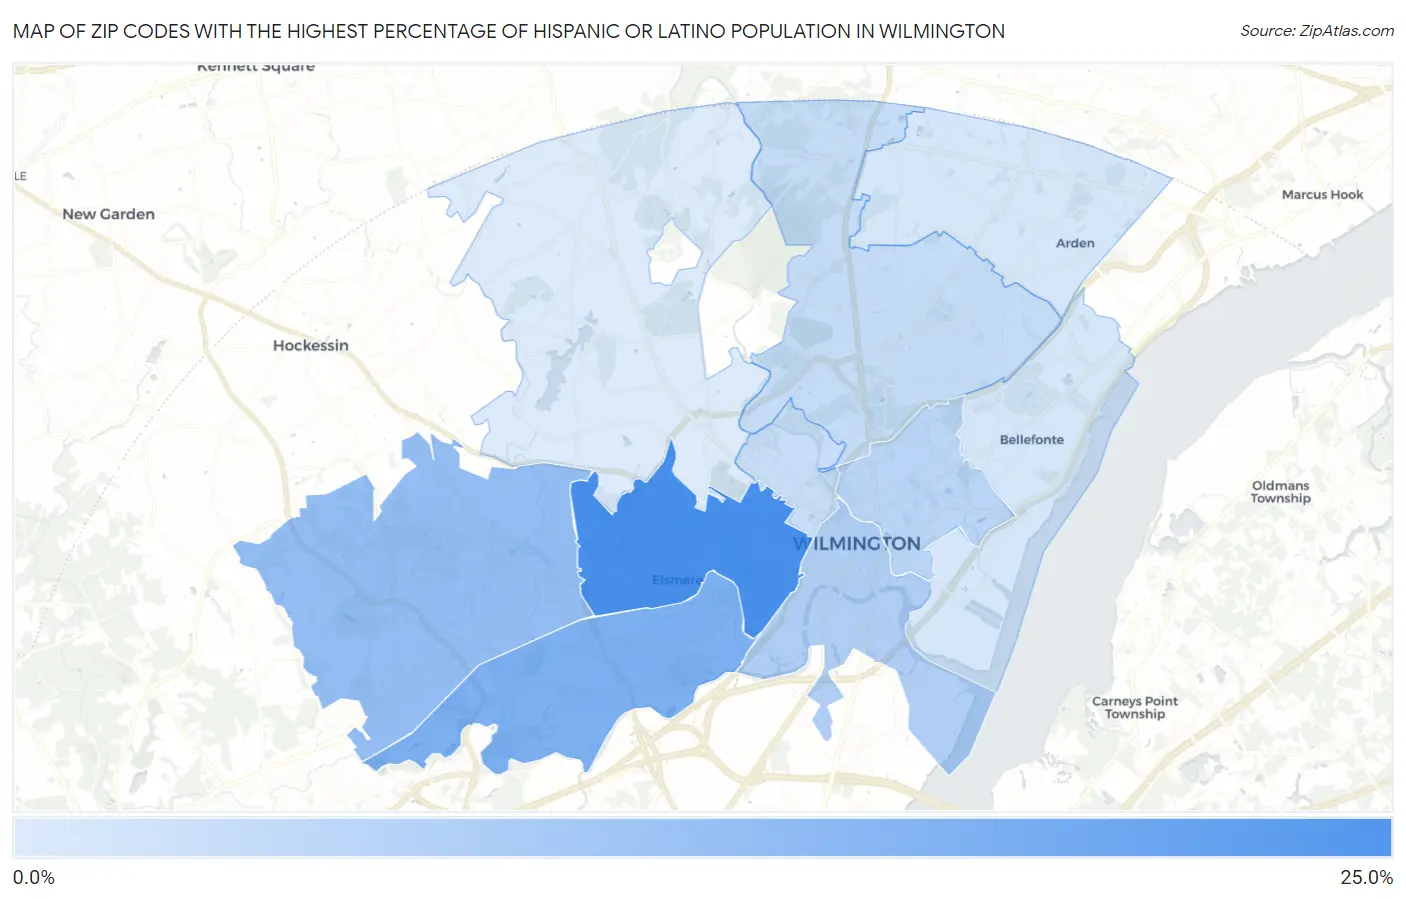
Map of Zip Codes with the Highest Percentage of Hispanic or Latino Population in Wilmington
1.2%
24.6%
Zip Codes with the Highest Percentage of Hispanic or Latino Population in Wilmington, DE
| Zip Code | Hispanic or Latino | vs State | vs National | |
| 1. | 19805 | 24.6% | 9.9%(+14.7)#4 | 18.7%(+5.98)#3,870 |
| 2. | 19804 | 15.6% | 9.9%(+5.67)#9 | 18.7%(-3.05)#6,115 |
| 3. | 19808 | 12.2% | 9.9%(+2.25)#13 | 18.7%(-6.47)#7,650 |
| 4. | 19801 | 7.8% | 9.9%(-2.14)#25 | 18.7%(-10.9)#10,750 |
| 5. | 19802 | 6.2% | 9.9%(-3.74)#38 | 18.7%(-12.5)#12,548 |
| 6. | 19803 | 4.6% | 9.9%(-5.33)#42 | 18.7%(-14.0)#14,969 |
| 7. | 19806 | 4.0% | 9.9%(-5.91)#45 | 18.7%(-14.6)#16,090 |
| 8. | 19809 | 2.3% | 9.9%(-7.61)#53 | 18.7%(-16.3)#20,125 |
| 9. | 19810 | 2.1% | 9.9%(-7.88)#54 | 18.7%(-16.6)#20,874 |
| 10. | 19807 | 1.2% | 9.9%(-8.72)#60 | 18.7%(-17.4)#23,441 |
1
Common Questions
What are the Top 5 Zip Codes with the Highest Percentage of Hispanic or Latino Population in Wilmington, DE?
Top 5 Zip Codes with the Highest Percentage of Hispanic or Latino Population in Wilmington, DE are:
What zip code has the Highest Percentage of Hispanic or Latino Population in Wilmington, DE?
19805 has the Highest Percentage of Hispanic or Latino Population in Wilmington, DE with 24.6%.
What is the Percentage of Hispanic or Latino Population in Wilmington, DE?
Percentage of Hispanic or Latino Population in Wilmington is 11.3%.
What is the Percentage of Hispanic or Latino Population in Delaware?
Percentage of Hispanic or Latino Population in Delaware is 9.9%.
What is the Percentage of Hispanic or Latino Population in the United States?
Percentage of Hispanic or Latino Population in the United States is 18.7%.