Immigrants from Uganda vs Macedonian 4 or more Vehicles in Household
COMPARE
Immigrants from Uganda
Macedonian
4 or more Vehicles in Household
4 or more Vehicles in Household Comparison
Immigrants from Uganda
Macedonians
5.9%
4 OR MORE VEHICLES IN HOUSEHOLD
7.5/ 100
METRIC RATING
228th/ 347
METRIC RANK
5.5%
4 OR MORE VEHICLES IN HOUSEHOLD
0.6/ 100
METRIC RATING
273rd/ 347
METRIC RANK
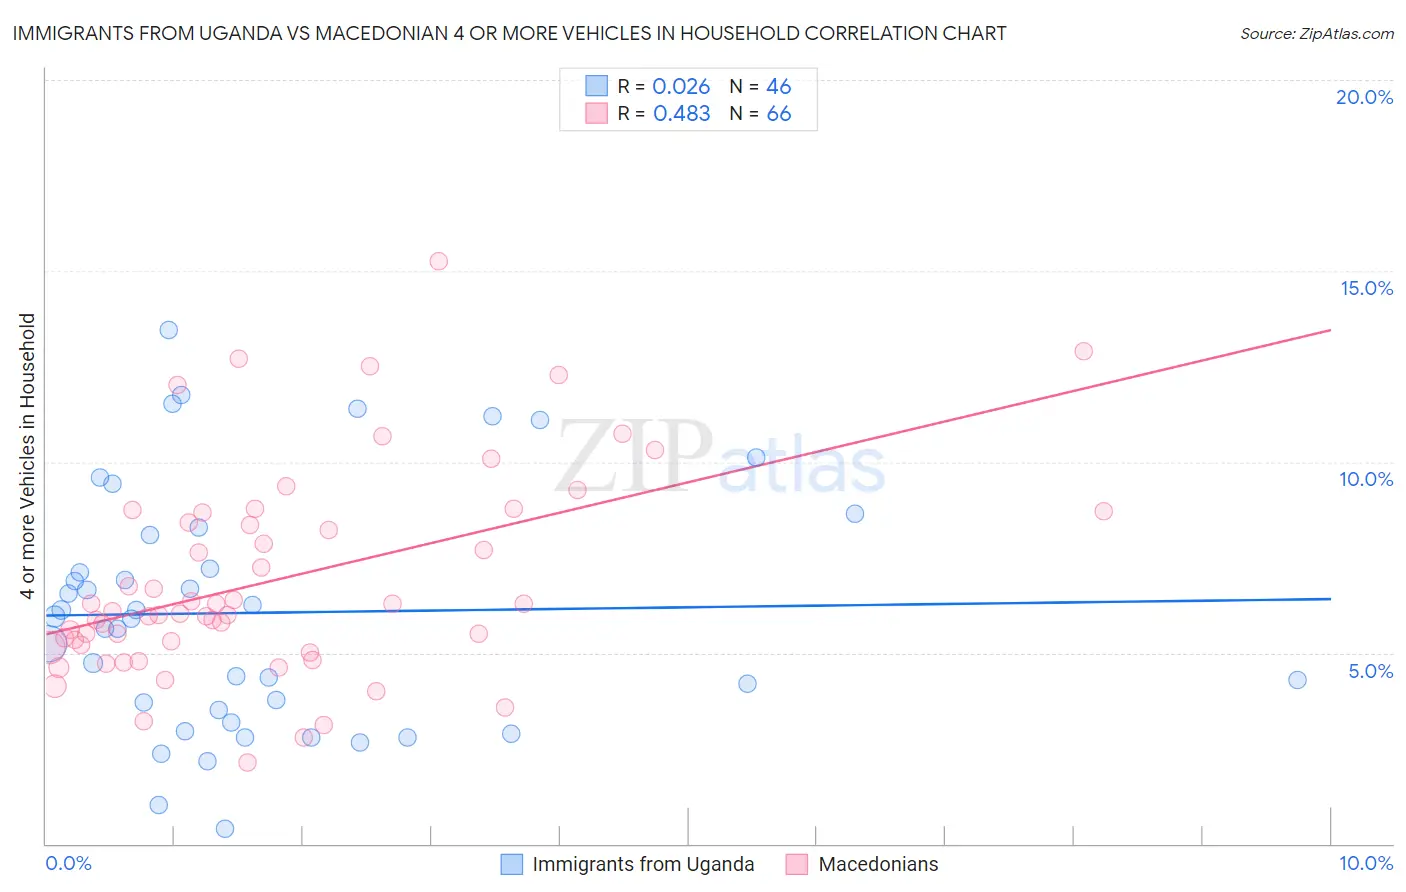
Immigrants from Uganda vs Macedonian 4 or more Vehicles in Household Correlation Chart
The statistical analysis conducted on geographies consisting of 125,864,473 people shows no correlation between the proportion of Immigrants from Uganda and percentage of households with 4 or more vehicles available in the United States with a correlation coefficient (R) of 0.026 and weighted average of 5.9%. Similarly, the statistical analysis conducted on geographies consisting of 131,939,711 people shows a moderate positive correlation between the proportion of Macedonians and percentage of households with 4 or more vehicles available in the United States with a correlation coefficient (R) of 0.483 and weighted average of 5.5%, a difference of 7.7%.
4 or more Vehicles in Household Correlation Summary
| Measurement | Immigrants from Uganda | Macedonian |
| Minimum | 0.38% | 2.1% |
| Maximum | 13.5% | 15.3% |
| Range | 13.1% | 13.1% |
| Mean | 6.1% | 6.9% |
| Median | 5.9% | 6.1% |
| Interquartile 25% (IQ1) | 3.5% | 5.2% |
| Interquartile 75% (IQ3) | 8.1% | 8.7% |
| Interquartile Range (IQR) | 4.6% | 3.5% |
| Standard Deviation (Sample) | 3.2% | 2.7% |
| Standard Deviation (Population) | 3.1% | 2.7% |
Similar Demographics by 4 or more Vehicles in Household
Demographics Similar to Immigrants from Uganda by 4 or more Vehicles in Household
In terms of 4 or more vehicles in household, the demographic groups most similar to Immigrants from Uganda are Immigrants from Western Asia (5.9%, a difference of 0.090%), Immigrants from Singapore (5.9%, a difference of 0.13%), Eastern European (5.9%, a difference of 0.28%), Immigrants from Malaysia (5.9%, a difference of 0.35%), and Immigrants from Switzerland (5.9%, a difference of 0.47%).
| Demographics | Rating | Rank | 4 or more Vehicles in Household |
| Immigrants | Moldova | 9.3 /100 | #221 | Tragic 6.0% |
| Cajuns | 9.2 /100 | #222 | Tragic 6.0% |
| Immigrants | Kenya | 9.2 /100 | #223 | Tragic 6.0% |
| Cubans | 9.2 /100 | #224 | Tragic 6.0% |
| Indonesians | 8.9 /100 | #225 | Tragic 6.0% |
| Immigrants | Singapore | 7.9 /100 | #226 | Tragic 5.9% |
| Immigrants | Western Asia | 7.8 /100 | #227 | Tragic 5.9% |
| Immigrants | Uganda | 7.5 /100 | #228 | Tragic 5.9% |
| Eastern Europeans | 6.8 /100 | #229 | Tragic 5.9% |
| Immigrants | Malaysia | 6.7 /100 | #230 | Tragic 5.9% |
| Immigrants | Switzerland | 6.4 /100 | #231 | Tragic 5.9% |
| Immigrants | Argentina | 6.0 /100 | #232 | Tragic 5.9% |
| Sierra Leoneans | 6.0 /100 | #233 | Tragic 5.9% |
| Africans | 4.6 /100 | #234 | Tragic 5.8% |
| Immigrants | Hungary | 4.6 /100 | #235 | Tragic 5.8% |
Demographics Similar to Macedonians by 4 or more Vehicles in Household
In terms of 4 or more vehicles in household, the demographic groups most similar to Macedonians are Immigrants from Kazakhstan (5.5%, a difference of 0.030%), Black/African American (5.5%, a difference of 0.12%), Immigrants from Sudan (5.5%, a difference of 0.23%), Cambodian (5.5%, a difference of 0.24%), and Immigrants from Latvia (5.5%, a difference of 0.25%).
| Demographics | Rating | Rank | 4 or more Vehicles in Household |
| Immigrants | Nepal | 0.9 /100 | #266 | Tragic 5.6% |
| Immigrants | Ukraine | 0.9 /100 | #267 | Tragic 5.6% |
| Colombians | 0.7 /100 | #268 | Tragic 5.5% |
| Carpatho Rusyns | 0.7 /100 | #269 | Tragic 5.5% |
| Okinawans | 0.6 /100 | #270 | Tragic 5.5% |
| Immigrants | Sudan | 0.6 /100 | #271 | Tragic 5.5% |
| Immigrants | Kazakhstan | 0.6 /100 | #272 | Tragic 5.5% |
| Macedonians | 0.6 /100 | #273 | Tragic 5.5% |
| Blacks/African Americans | 0.6 /100 | #274 | Tragic 5.5% |
| Cambodians | 0.5 /100 | #275 | Tragic 5.5% |
| Immigrants | Latvia | 0.5 /100 | #276 | Tragic 5.5% |
| Immigrants | Bulgaria | 0.5 /100 | #277 | Tragic 5.5% |
| Immigrants | Eastern Europe | 0.4 /100 | #278 | Tragic 5.4% |
| Immigrants | Uruguay | 0.3 /100 | #279 | Tragic 5.4% |
| Alsatians | 0.3 /100 | #280 | Tragic 5.4% |