Immigrants from Uganda vs Australian 4 or more Vehicles in Household
COMPARE
Immigrants from Uganda
Australian
4 or more Vehicles in Household
4 or more Vehicles in Household Comparison
Immigrants from Uganda
Australians
5.9%
4 OR MORE VEHICLES IN HOUSEHOLD
7.5/ 100
METRIC RATING
228th/ 347
METRIC RANK
6.6%
4 OR MORE VEHICLES IN HOUSEHOLD
80.8/ 100
METRIC RATING
141st/ 347
METRIC RANK
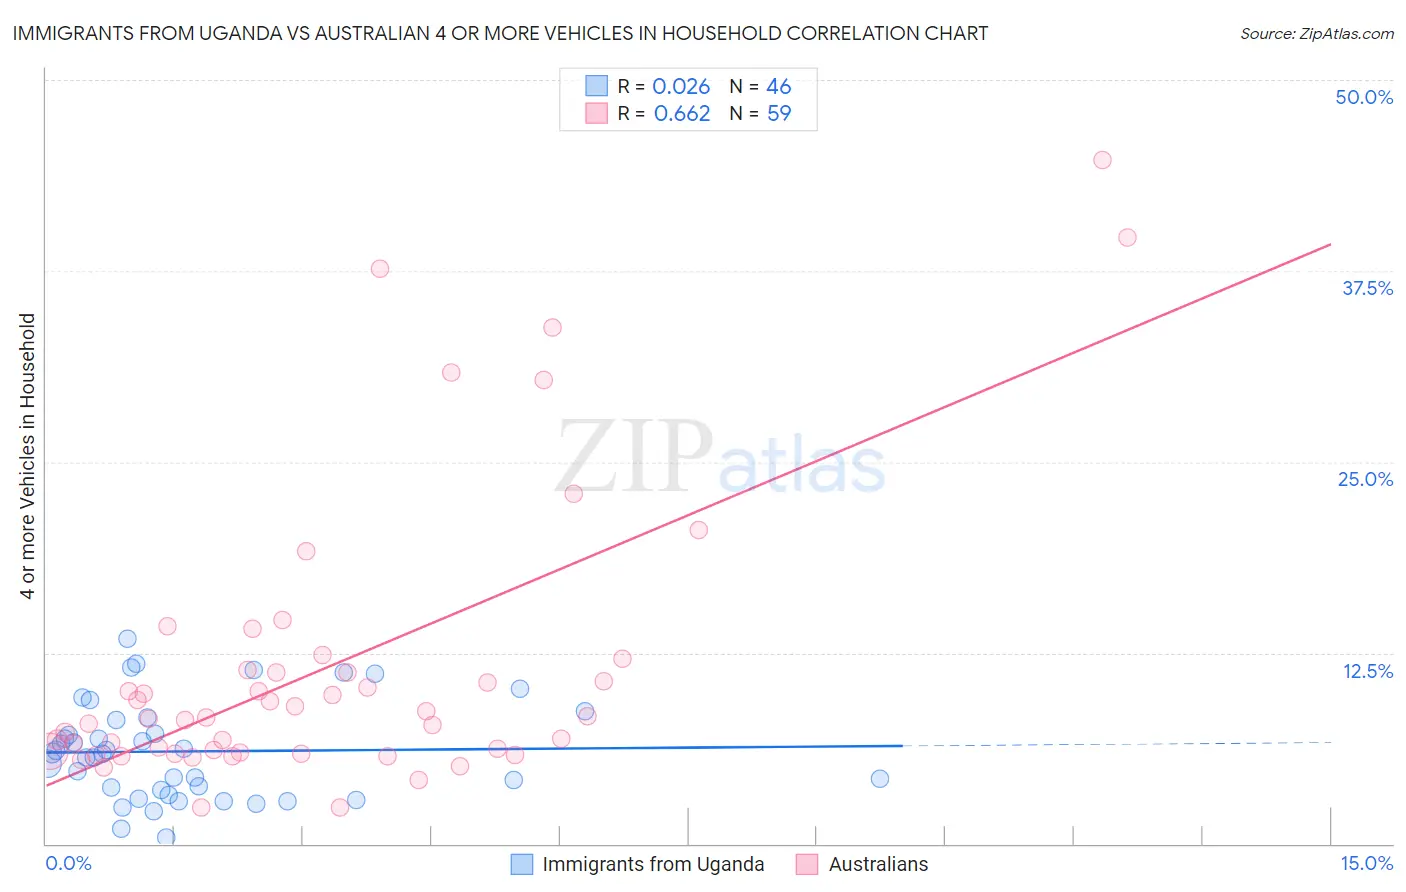
Immigrants from Uganda vs Australian 4 or more Vehicles in Household Correlation Chart
The statistical analysis conducted on geographies consisting of 125,864,473 people shows no correlation between the proportion of Immigrants from Uganda and percentage of households with 4 or more vehicles available in the United States with a correlation coefficient (R) of 0.026 and weighted average of 5.9%. Similarly, the statistical analysis conducted on geographies consisting of 223,029,698 people shows a significant positive correlation between the proportion of Australians and percentage of households with 4 or more vehicles available in the United States with a correlation coefficient (R) of 0.662 and weighted average of 6.6%, a difference of 10.7%.
4 or more Vehicles in Household Correlation Summary
| Measurement | Immigrants from Uganda | Australian |
| Minimum | 0.38% | 2.4% |
| Maximum | 13.5% | 44.7% |
| Range | 13.1% | 42.4% |
| Mean | 6.1% | 11.5% |
| Median | 5.9% | 8.3% |
| Interquartile 25% (IQ1) | 3.5% | 6.0% |
| Interquartile 75% (IQ3) | 8.1% | 11.4% |
| Interquartile Range (IQR) | 4.6% | 5.4% |
| Standard Deviation (Sample) | 3.2% | 9.4% |
| Standard Deviation (Population) | 3.1% | 9.3% |
Similar Demographics by 4 or more Vehicles in Household
Demographics Similar to Immigrants from Uganda by 4 or more Vehicles in Household
In terms of 4 or more vehicles in household, the demographic groups most similar to Immigrants from Uganda are Immigrants from Western Asia (5.9%, a difference of 0.090%), Immigrants from Singapore (5.9%, a difference of 0.13%), Eastern European (5.9%, a difference of 0.28%), Immigrants from Malaysia (5.9%, a difference of 0.35%), and Immigrants from Switzerland (5.9%, a difference of 0.47%).
| Demographics | Rating | Rank | 4 or more Vehicles in Household |
| Immigrants | Moldova | 9.3 /100 | #221 | Tragic 6.0% |
| Cajuns | 9.2 /100 | #222 | Tragic 6.0% |
| Immigrants | Kenya | 9.2 /100 | #223 | Tragic 6.0% |
| Cubans | 9.2 /100 | #224 | Tragic 6.0% |
| Indonesians | 8.9 /100 | #225 | Tragic 6.0% |
| Immigrants | Singapore | 7.9 /100 | #226 | Tragic 5.9% |
| Immigrants | Western Asia | 7.8 /100 | #227 | Tragic 5.9% |
| Immigrants | Uganda | 7.5 /100 | #228 | Tragic 5.9% |
| Eastern Europeans | 6.8 /100 | #229 | Tragic 5.9% |
| Immigrants | Malaysia | 6.7 /100 | #230 | Tragic 5.9% |
| Immigrants | Switzerland | 6.4 /100 | #231 | Tragic 5.9% |
| Immigrants | Argentina | 6.0 /100 | #232 | Tragic 5.9% |
| Sierra Leoneans | 6.0 /100 | #233 | Tragic 5.9% |
| Africans | 4.6 /100 | #234 | Tragic 5.8% |
| Immigrants | Hungary | 4.6 /100 | #235 | Tragic 5.8% |
Demographics Similar to Australians by 4 or more Vehicles in Household
In terms of 4 or more vehicles in household, the demographic groups most similar to Australians are Slavic (6.6%, a difference of 0.13%), Immigrants from Iraq (6.5%, a difference of 0.20%), Jordanian (6.6%, a difference of 0.21%), Immigrants from Canada (6.5%, a difference of 0.33%), and Immigrants from North America (6.5%, a difference of 0.35%).
| Demographics | Rating | Rank | 4 or more Vehicles in Household |
| Ottawa | 86.9 /100 | #134 | Excellent 6.6% |
| Tohono O'odham | 86.7 /100 | #135 | Excellent 6.6% |
| Luxembourgers | 86.4 /100 | #136 | Excellent 6.6% |
| French Canadians | 85.4 /100 | #137 | Excellent 6.6% |
| Italians | 84.5 /100 | #138 | Excellent 6.6% |
| Jordanians | 82.1 /100 | #139 | Excellent 6.6% |
| Slavs | 81.6 /100 | #140 | Excellent 6.6% |
| Australians | 80.8 /100 | #141 | Excellent 6.6% |
| Immigrants | Iraq | 79.4 /100 | #142 | Good 6.5% |
| Immigrants | Canada | 78.6 /100 | #143 | Good 6.5% |
| Immigrants | North America | 78.5 /100 | #144 | Good 6.5% |
| Croatians | 77.8 /100 | #145 | Good 6.5% |
| Immigrants | Costa Rica | 74.4 /100 | #146 | Good 6.5% |
| Immigrants | Iran | 73.9 /100 | #147 | Good 6.5% |
| Immigrants | Jordan | 73.7 /100 | #148 | Good 6.5% |