Cree vs Welsh 4 or more Vehicles in Household
COMPARE
Cree
Welsh
4 or more Vehicles in Household
4 or more Vehicles in Household Comparison
Cree
Welsh
7.2%
4 OR MORE VEHICLES IN HOUSEHOLD
99.7/ 100
METRIC RATING
85th/ 347
METRIC RANK
7.5%
4 OR MORE VEHICLES IN HOUSEHOLD
99.9/ 100
METRIC RATING
68th/ 347
METRIC RANK
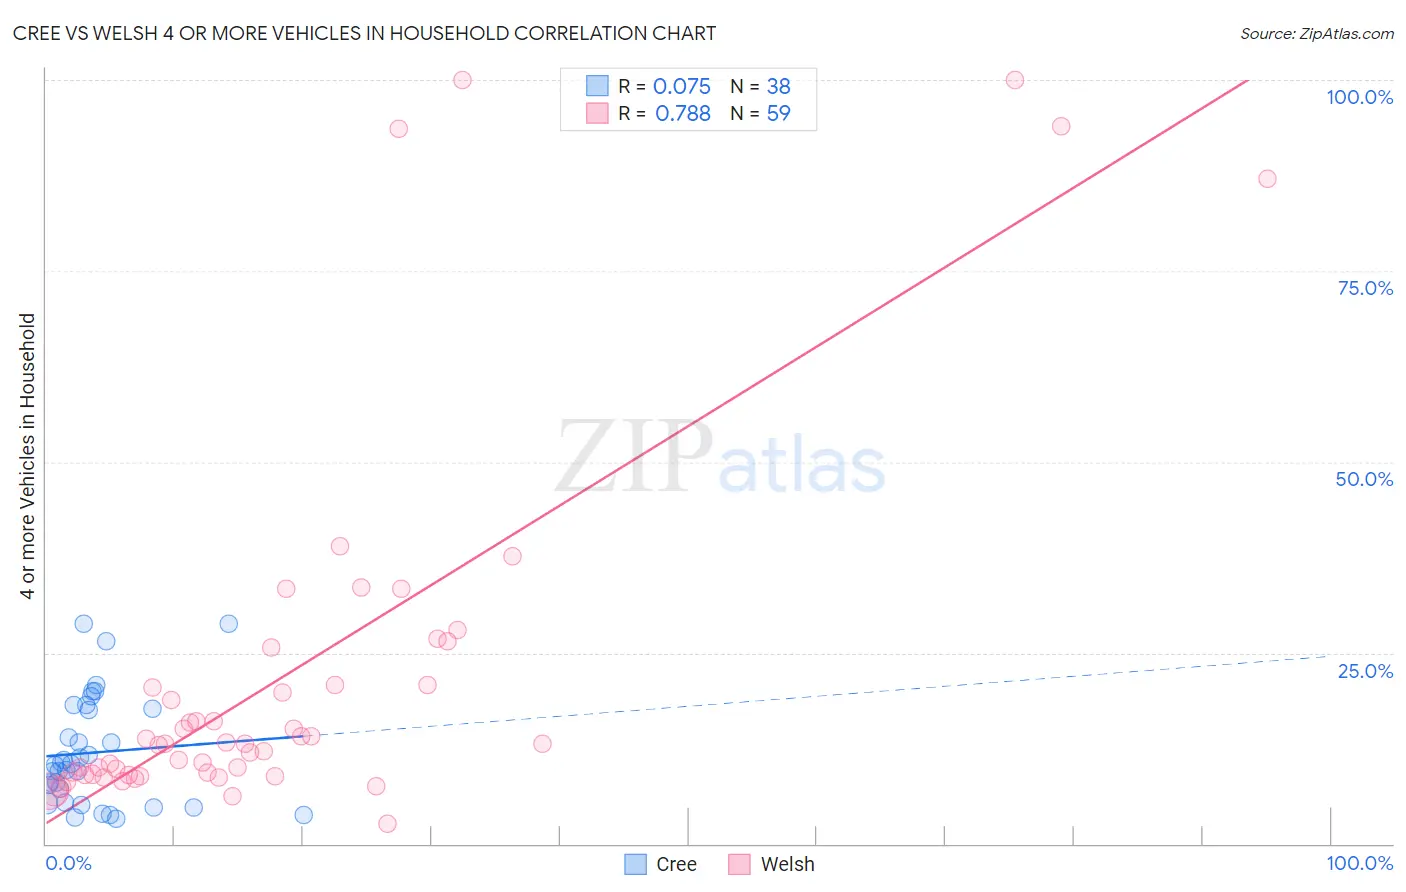
Cree vs Welsh 4 or more Vehicles in Household Correlation Chart
The statistical analysis conducted on geographies consisting of 76,129,414 people shows a slight positive correlation between the proportion of Cree and percentage of households with 4 or more vehicles available in the United States with a correlation coefficient (R) of 0.075 and weighted average of 7.2%. Similarly, the statistical analysis conducted on geographies consisting of 526,008,670 people shows a strong positive correlation between the proportion of Welsh and percentage of households with 4 or more vehicles available in the United States with a correlation coefficient (R) of 0.788 and weighted average of 7.5%, a difference of 3.5%.
4 or more Vehicles in Household Correlation Summary
| Measurement | Cree | Welsh |
| Minimum | 3.3% | 2.6% |
| Maximum | 28.9% | 100.0% |
| Range | 25.5% | 97.4% |
| Mean | 11.9% | 21.8% |
| Median | 10.4% | 13.1% |
| Interquartile 25% (IQ1) | 5.4% | 9.1% |
| Interquartile 75% (IQ3) | 17.7% | 20.8% |
| Interquartile Range (IQR) | 12.3% | 11.8% |
| Standard Deviation (Sample) | 7.1% | 24.0% |
| Standard Deviation (Population) | 7.0% | 23.8% |
Demographics Similar to Cree and Welsh by 4 or more Vehicles in Household
In terms of 4 or more vehicles in household, the demographic groups most similar to Cree are Afghan (7.3%, a difference of 0.17%), Immigrants from Indonesia (7.2%, a difference of 0.18%), Potawatomi (7.3%, a difference of 0.49%), Northern European (7.3%, a difference of 0.61%), and Finnish (7.3%, a difference of 0.81%). Similarly, the demographic groups most similar to Welsh are American (7.5%, a difference of 0.36%), Immigrants from Taiwan (7.5%, a difference of 0.37%), German (7.5%, a difference of 0.59%), Scottish (7.4%, a difference of 0.67%), and Chickasaw (7.4%, a difference of 0.80%).
| Demographics | Rating | Rank | 4 or more Vehicles in Household |
| Immigrants | Taiwan | 99.9 /100 | #66 | Exceptional 7.5% |
| Americans | 99.9 /100 | #67 | Exceptional 7.5% |
| Welsh | 99.9 /100 | #68 | Exceptional 7.5% |
| Germans | 99.9 /100 | #69 | Exceptional 7.5% |
| Scottish | 99.9 /100 | #70 | Exceptional 7.4% |
| Chickasaw | 99.9 /100 | #71 | Exceptional 7.4% |
| Scotch-Irish | 99.9 /100 | #72 | Exceptional 7.4% |
| Portuguese | 99.9 /100 | #73 | Exceptional 7.4% |
| Icelanders | 99.9 /100 | #74 | Exceptional 7.4% |
| Immigrants | Cambodia | 99.9 /100 | #75 | Exceptional 7.4% |
| Laotians | 99.9 /100 | #76 | Exceptional 7.4% |
| Apache | 99.9 /100 | #77 | Exceptional 7.4% |
| Whites/Caucasians | 99.8 /100 | #78 | Exceptional 7.4% |
| Czechs | 99.8 /100 | #79 | Exceptional 7.4% |
| Alaska Natives | 99.8 /100 | #80 | Exceptional 7.3% |
| Finns | 99.8 /100 | #81 | Exceptional 7.3% |
| Northern Europeans | 99.8 /100 | #82 | Exceptional 7.3% |
| Potawatomi | 99.7 /100 | #83 | Exceptional 7.3% |
| Afghans | 99.7 /100 | #84 | Exceptional 7.3% |
| Cree | 99.7 /100 | #85 | Exceptional 7.2% |
| Immigrants | Indonesia | 99.6 /100 | #86 | Exceptional 7.2% |