Immigrants from Armenia vs Kenyan 1 or more Vehicles in Household

COMPARE

Immigrants from Armenia
Race
Ancestry
AfghanAfricanAlaska NativeAlaskan AthabascanAlbanianAleutAlsatianAmericanApacheArabArapahoArgentineanArmenianAssyrian/Chaldean/SyriacAustralianAustrianBahamianBangladeshiBarbadianBasqueBelgianBelizeanBermudanBhutaneseBlackfeetBolivianBrazilianBritishBritish West IndianBulgarianBurmeseCajunCambodianCanadianCape VerdeanCarpatho RusynCelticCentral AmericanCentral American IndianCherokeeCheyenneChickasawChileanChineseChippewaChoctawColombianColvilleComancheCosta RicanCreeCreekCroatianCrowCubanCypriotCzechCzechoslovakianDanishDelawareDominicanDutchDutch West IndianEastern EuropeanEcuadorianEgyptianEnglishEstonianEthiopianEuropeanFijianFilipinoFinnishFrenchFrench American IndianFrench CanadianGermanGerman RussianGhanaianGreekGuamanian/ChamorroGuatemalanGuyaneseHaitianHmongHonduranHopiHoumaHungarianIcelanderIndian (Asian)IndonesianInupiatIranianIraqiIrishIroquoisIsraeliItalianJamaicanJapaneseJordanianKiowaKoreanLaotianLatvianLebaneseLiberianLithuanianLumbeeLuxembourgerMacedonianMalaysianMalteseMarshalleseMenomineeMexicanMexican American IndianMongolianMoroccanNative HawaiianNavajoNepaleseNew ZealanderNicaraguanNigerianNorthern EuropeanNorwegianOkinawanOsageOttawaPaiutePakistaniPalestinianPanamanianParaguayanPennsylvania GermanPeruvianPimaPolishPortuguesePotawatomiPuebloPuerto RicanPuget Sound SalishRomanianRussianSalvadoranSamoanScandinavianScotch-IrishScottishSeminoleSenegaleseSerbianShoshoneSierra LeoneanSiouxSlavicSlovakSloveneSomaliSouth AfricanSouth AmericanSouth American IndianSoviet UnionSpaniardSpanishSpanish AmericanSpanish American IndianSri LankanSubsaharan AfricanSudaneseSwedishSwissSyrianTaiwaneseThaiTlingit-HaidaTohono O'OdhamTonganTrinidadian and TobagonianTsimshianTurkishU.S. Virgin IslanderUgandanUkrainianUruguayanUteVenezuelanVietnameseWelshWest IndianYakamaYaquiYugoslavianYumanYup'ikZimbabwean
Immigration
NonimmigrantsImmigrantsAfghanistanAfricaAlbaniaArgentinaArmeniaAsiaAustraliaAustriaBahamasBangladeshBarbadosBelarusBelgiumBelizeBoliviaBosnia and HerzegovinaBrazilBulgariaBurma/MyanmarCabo VerdeCambodiaCameroonCanadaCaribbeanCentral AmericaChileChinaColombiaCongoCosta RicaCroatiaCubaCzechoslovakiaDenmarkDominicaDominican RepublicEastern AfricaEastern AsiaEastern EuropeEcuadorEgyptEl SalvadorEnglandEritreaEthiopiaEuropeFijiFranceGermanyGhanaGreeceGrenadaGuatemalaGuyanaHaitiHondurasHong KongHungaryIndiaIndonesiaIranIraqIrelandIsraelItalyJamaicaJapanJordanKazakhstanKenyaKoreaKuwaitLaosLatin AmericaLatviaLebanonLiberiaLithuaniaMalaysiaMexicoMicronesiaMiddle AfricaMoldovaMoroccoNepalNetherlandsNicaraguaNigeriaNorth AmericaNorth MacedoniaNorthern AfricaNorthern EuropeNorwayOceaniaPakistanPanamaPeruPhilippinesPolandPortugalRomaniaRussiaSaudi ArabiaScotlandSenegalSerbiaSierra LeoneSingaporeSomaliaSouth AfricaSouth AmericaSouth Central AsiaSouth Eastern AsiaSouthern EuropeSpainSri LankaSt. Vincent and the GrenadinesSudanSwedenSwitzerlandSyriaTaiwanThailandTrinidad and TobagoTurkeyUgandaUkraineUruguayUzbekistanVenezuelaVietnamWest IndiesWestern AfricaWestern AsiaWestern EuropeYemenZaireZimbabweAzores
Kenyan
Race
Ancestry
AfghanAfricanAlaska NativeAlaskan AthabascanAlbanianAleutAlsatianAmericanApacheArabArapahoArgentineanArmenianAssyrian/Chaldean/SyriacAustralianAustrianBahamianBangladeshiBarbadianBasqueBelgianBelizeanBermudanBhutaneseBlackfeetBolivianBrazilianBritishBritish West IndianBulgarianBurmeseCajunCambodianCanadianCape VerdeanCarpatho RusynCelticCentral AmericanCentral American IndianCherokeeCheyenneChickasawChileanChineseChippewaChoctawColombianColvilleComancheCosta RicanCreeCreekCroatianCrowCubanCypriotCzechCzechoslovakianDanishDelawareDominicanDutchDutch West IndianEastern EuropeanEcuadorianEgyptianEnglishEstonianEthiopianEuropeanFijianFilipinoFinnishFrenchFrench American IndianFrench CanadianGermanGerman RussianGhanaianGreekGuamanian/ChamorroGuatemalanGuyaneseHaitianHmongHonduranHopiHoumaHungarianIcelanderIndian (Asian)IndonesianInupiatIranianIraqiIrishIroquoisIsraeliItalianJamaicanJapaneseJordanianKenyanKiowaKoreanLaotianLatvianLebaneseLiberianLithuanianLumbeeLuxembourgerMacedonianMalaysianMalteseMarshalleseMenomineeMexicanMexican American IndianMongolianMoroccanNative HawaiianNavajoNepaleseNew ZealanderNicaraguanNigerianNorthern EuropeanNorwegianOkinawanOsageOttawaPaiutePakistaniPalestinianPanamanianParaguayanPennsylvania GermanPeruvianPimaPolishPortuguesePotawatomiPuebloPuerto RicanPuget Sound SalishRomanianRussianSalvadoranSamoanScandinavianScotch-IrishScottishSeminoleSenegaleseSerbianShoshoneSierra LeoneanSiouxSlavicSlovakSloveneSomaliSouth AfricanSouth AmericanSouth American IndianSoviet UnionSpaniardSpanishSpanish AmericanSpanish American IndianSri LankanSubsaharan AfricanSudaneseSwedishSwissSyrianTaiwaneseThaiTlingit-HaidaTohono O'OdhamTonganTrinidadian and TobagonianTsimshianTurkishU.S. Virgin IslanderUgandanUkrainianUruguayanUteVenezuelanVietnameseWelshWest IndianYakamaYaquiYugoslavianYumanYup'ikZimbabwean
Immigration
NonimmigrantsImmigrantsAfghanistanAfricaAlbaniaArgentinaAsiaAustraliaAustriaBahamasBangladeshBarbadosBelarusBelgiumBelizeBoliviaBosnia and HerzegovinaBrazilBulgariaBurma/MyanmarCabo VerdeCambodiaCameroonCanadaCaribbeanCentral AmericaChileChinaColombiaCongoCosta RicaCroatiaCubaCzechoslovakiaDenmarkDominicaDominican RepublicEastern AfricaEastern AsiaEastern EuropeEcuadorEgyptEl SalvadorEnglandEritreaEthiopiaEuropeFijiFranceGermanyGhanaGreeceGrenadaGuatemalaGuyanaHaitiHondurasHong KongHungaryIndiaIndonesiaIranIraqIrelandIsraelItalyJamaicaJapanJordanKazakhstanKenyaKoreaKuwaitLaosLatin AmericaLatviaLebanonLiberiaLithuaniaMalaysiaMexicoMicronesiaMiddle AfricaMoldovaMoroccoNepalNetherlandsNicaraguaNigeriaNorth AmericaNorth MacedoniaNorthern AfricaNorthern EuropeNorwayOceaniaPakistanPanamaPeruPhilippinesPolandPortugalRomaniaRussiaSaudi ArabiaScotlandSenegalSerbiaSierra LeoneSingaporeSomaliaSouth AfricaSouth AmericaSouth Central AsiaSouth Eastern AsiaSouthern EuropeSpainSri LankaSt. Vincent and the GrenadinesSudanSwedenSwitzerlandSyriaTaiwanThailandTrinidad and TobagoTurkeyUgandaUkraineUruguayUzbekistanVenezuelaVietnamWest IndiesWestern AfricaWestern AsiaWestern EuropeYemenZaireZimbabweAzores
1 or more Vehicles in Household
Income
Poverty
Unemployment
Labor Participation
Family Structure
Vehicle Availability
Education Level
Disability

1 or more Vehicles in Household Comparison

Immigrants from Armenia

Kenyans

Fair
Excellent
89.4%
1 OR MORE VEHICLES IN HOUSEHOLD
31.8/ 100
METRIC RATING
195th/ 347
METRIC RANK
90.4%
1 OR MORE VEHICLES IN HOUSEHOLD
87.0/ 100
METRIC RATING
134th/ 347
METRIC RANK

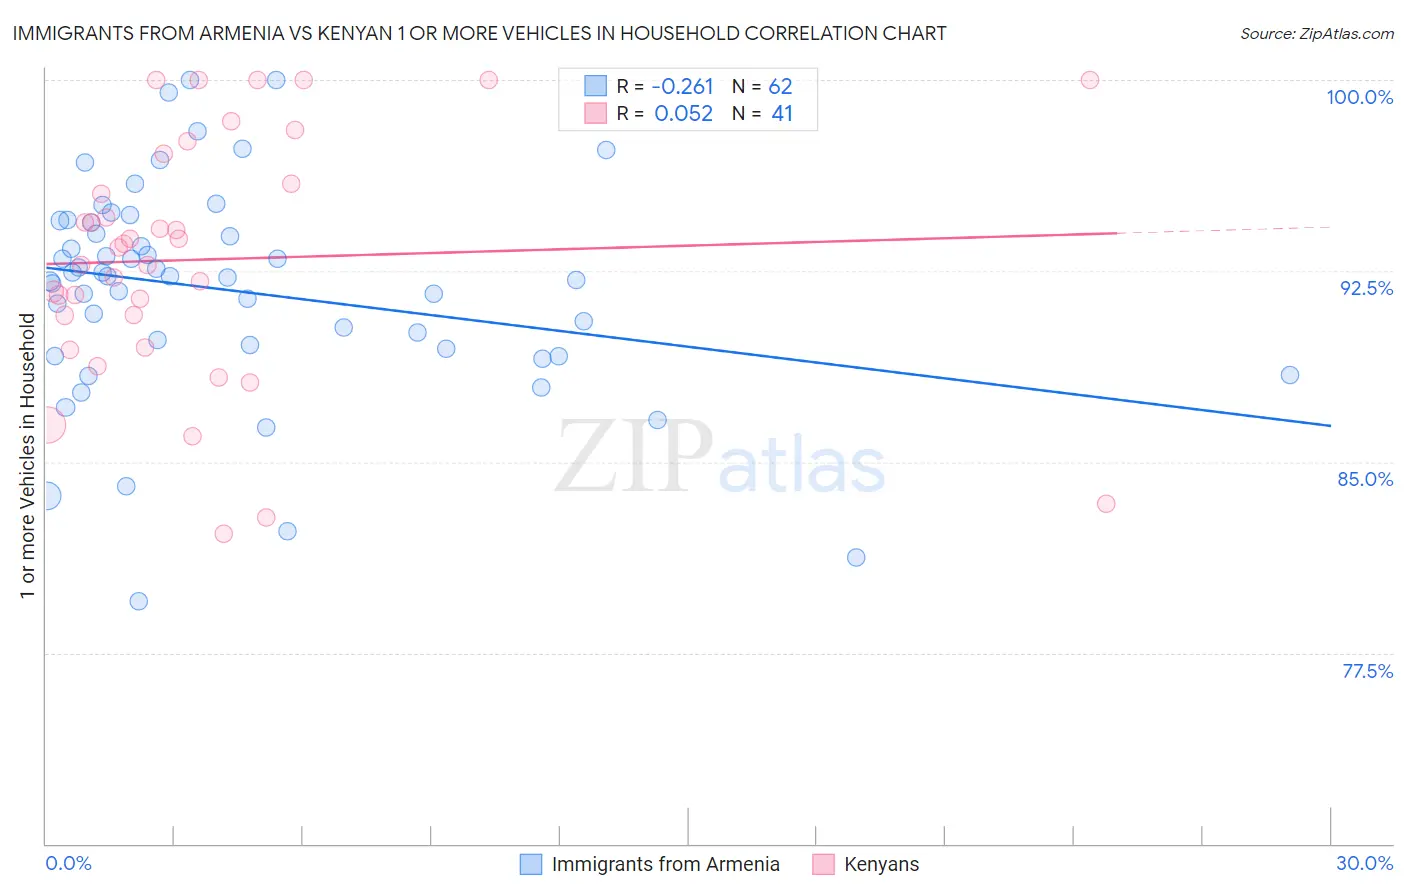
Immigrants from Armenia vs Kenyan 1 or more Vehicles in Household Correlation Chart

The statistical analysis conducted on geographies consisting of 97,564,455 people shows a weak negative correlation between the proportion of Immigrants from Armenia and percentage of households with 1 or more vehicles available in the United States with a correlation coefficient (R) of -0.261 and weighted average of 89.4%. Similarly, the statistical analysis conducted on geographies consisting of 168,180,305 people shows a slight positive correlation between the proportion of Kenyans and percentage of households with 1 or more vehicles available in the United States with a correlation coefficient (R) of 0.052 and weighted average of 90.4%, a difference of 1.0%.
Immigrants from Armenia vs Kenyan 1 or more Vehicles in Household

1 or more Vehicles in Household Correlation Summary

MeasurementImmigrants from ArmeniaKenyan
Minimum79.5%82.2%
Maximum100.0%100.0%
Range20.5%17.8%
Mean91.7%93.0%
Median92.3%93.4%
Interquartile 25% (IQ1)89.4%90.1%
Interquartile 75% (IQ3)94.4%96.5%
Interquartile Range (IQR)5.0%6.4%
Standard Deviation (Sample)4.2%4.8%
Standard Deviation (Population)4.2%4.8%

Similar Demographics by 1 or more Vehicles in Household

Demographics Similar to Immigrants from Armenia by 1 or more Vehicles in Household

In terms of 1 or more vehicles in household, the demographic groups most similar to Immigrants from Armenia are Immigrants from Eritrea (89.4%, a difference of 0.020%), Immigrants from Northern Europe (89.5%, a difference of 0.060%), Immigrants from North Macedonia (89.5%, a difference of 0.080%), Immigrants from Poland (89.5%, a difference of 0.090%), and Carpatho Rusyn (89.5%, a difference of 0.10%).
DemographicsRating | Rank1 or more Vehicles in Household
Immigrants | Nepal
38.9
/100
|
#188
Fair
89.5%
Carpatho Rusyns
37.8
/100
|
#189
Fair
89.5%
Shoshone
37.5
/100
|
#190
Fair
89.5%
Immigrants | Poland
37.1
/100
|
#191
Fair
89.5%
Immigrants | North Macedonia
36.5
/100
|
#192
Fair
89.5%
Immigrants | Northern Europe
35.5
/100
|
#193
Fair
89.5%
Immigrants | Eritrea
33.2
/100
|
#194
Fair
89.4%
Immigrants | Armenia
31.8
/100
|
#195
Fair
89.4%
Crow
24.3
/100
|
#196
Fair
89.3%
Immigrants | Sweden
23.6
/100
|
#197
Fair
89.3%
Pennsylvania Germans
22.9
/100
|
#198
Fair
89.3%
Immigrants | Asia
22.8
/100
|
#199
Fair
89.3%
Central Americans
21.4
/100
|
#200
Fair
89.2%
Immigrants | Western Europe
20.5
/100
|
#201
Fair
89.2%
Iroquois
19.8
/100
|
#202
Poor
89.2%

Demographics Similar to Kenyans by 1 or more Vehicles in Household

In terms of 1 or more vehicles in household, the demographic groups most similar to Kenyans are Immigrants from Oceania (90.4%, a difference of 0.0%), Immigrants from Syria (90.4%, a difference of 0.020%), Hungarian (90.3%, a difference of 0.020%), Latvian (90.3%, a difference of 0.020%), and Syrian (90.3%, a difference of 0.020%).
DemographicsRating | Rank1 or more Vehicles in Household
Immigrants | Azores
89.1
/100
|
#127
Excellent
90.4%
Burmese
89.0
/100
|
#128
Excellent
90.4%
Marshallese
88.9
/100
|
#129
Excellent
90.4%
Nicaraguans
88.8
/100
|
#130
Excellent
90.4%
Immigrants | Kenya
88.5
/100
|
#131
Excellent
90.4%
Immigrants | South Africa
88.1
/100
|
#132
Excellent
90.4%
Immigrants | Syria
87.5
/100
|
#133
Excellent
90.4%
Kenyans
87.0
/100
|
#134
Excellent
90.4%
Immigrants | Oceania
86.9
/100
|
#135
Excellent
90.4%
Hungarians
86.5
/100
|
#136
Excellent
90.3%
Latvians
86.3
/100
|
#137
Excellent
90.3%
Syrians
86.3
/100
|
#138
Excellent
90.3%
Estonians
85.6
/100
|
#139
Excellent
90.3%
Sudanese
85.2
/100
|
#140
Excellent
90.3%
Immigrants | Moldova
83.1
/100
|
#141
Excellent
90.2%