Australian vs Immigrants from Norway 1 or more Vehicles in Household

COMPARE

Australian
Race
Ancestry
AfghanAfricanAlaska NativeAlaskan AthabascanAlbanianAleutAlsatianAmericanApacheArabArapahoArgentineanArmenianAssyrian/Chaldean/SyriacAustralianAustrianBahamianBangladeshiBarbadianBasqueBelgianBelizeanBermudanBhutaneseBlackfeetBolivianBrazilianBritishBritish West IndianBulgarianBurmeseCajunCambodianCanadianCape VerdeanCarpatho RusynCelticCentral AmericanCentral American IndianCherokeeCheyenneChickasawChileanChineseChippewaChoctawColombianColvilleComancheCosta RicanCreeCreekCroatianCrowCubanCypriotCzechCzechoslovakianDanishDelawareDominicanDutchDutch West IndianEastern EuropeanEcuadorianEgyptianEnglishEstonianEthiopianEuropeanFijianFilipinoFinnishFrenchFrench American IndianFrench CanadianGermanGerman RussianGhanaianGreekGuamanian/ChamorroGuatemalanGuyaneseHaitianHmongHonduranHopiHoumaHungarianIcelanderIndian (Asian)IndonesianInupiatIranianIraqiIrishIroquoisIsraeliItalianJamaicanJapaneseJordanianKenyanKiowaKoreanLaotianLatvianLebaneseLiberianLithuanianLumbeeLuxembourgerMacedonianMalaysianMalteseMarshalleseMenomineeMexicanMexican American IndianMongolianMoroccanNative HawaiianNavajoNepaleseNew ZealanderNicaraguanNigerianNorthern EuropeanNorwegianOkinawanOsageOttawaPaiutePakistaniPalestinianPanamanianParaguayanPennsylvania GermanPeruvianPimaPolishPortuguesePotawatomiPuebloPuerto RicanPuget Sound SalishRomanianRussianSalvadoranSamoanScandinavianScotch-IrishScottishSeminoleSenegaleseSerbianShoshoneSierra LeoneanSiouxSlavicSlovakSloveneSomaliSouth AfricanSouth AmericanSouth American IndianSoviet UnionSpaniardSpanishSpanish AmericanSpanish American IndianSri LankanSubsaharan AfricanSudaneseSwedishSwissSyrianTaiwaneseThaiTlingit-HaidaTohono O'OdhamTonganTrinidadian and TobagonianTsimshianTurkishU.S. Virgin IslanderUgandanUkrainianUruguayanUteVenezuelanVietnameseWelshWest IndianYakamaYaquiYugoslavianYumanYup'ikZimbabwean
Immigration
NonimmigrantsImmigrantsAfghanistanAfricaAlbaniaArgentinaArmeniaAsiaAustraliaAustriaBahamasBangladeshBarbadosBelarusBelgiumBelizeBoliviaBosnia and HerzegovinaBrazilBulgariaBurma/MyanmarCabo VerdeCambodiaCameroonCanadaCaribbeanCentral AmericaChileChinaColombiaCongoCosta RicaCroatiaCubaCzechoslovakiaDenmarkDominicaDominican RepublicEastern AfricaEastern AsiaEastern EuropeEcuadorEgyptEl SalvadorEnglandEritreaEthiopiaEuropeFijiFranceGermanyGhanaGreeceGrenadaGuatemalaGuyanaHaitiHondurasHong KongHungaryIndiaIndonesiaIranIraqIrelandIsraelItalyJamaicaJapanJordanKazakhstanKenyaKoreaKuwaitLaosLatin AmericaLatviaLebanonLiberiaLithuaniaMalaysiaMexicoMicronesiaMiddle AfricaMoldovaMoroccoNepalNetherlandsNicaraguaNigeriaNorth AmericaNorth MacedoniaNorthern AfricaNorthern EuropeOceaniaPakistanPanamaPeruPhilippinesPolandPortugalRomaniaRussiaSaudi ArabiaScotlandSenegalSerbiaSierra LeoneSingaporeSomaliaSouth AfricaSouth AmericaSouth Central AsiaSouth Eastern AsiaSouthern EuropeSpainSri LankaSt. Vincent and the GrenadinesSudanSwedenSwitzerlandSyriaTaiwanThailandTrinidad and TobagoTurkeyUgandaUkraineUruguayUzbekistanVenezuelaVietnamWest IndiesWestern AfricaWestern AsiaWestern EuropeYemenZaireZimbabweAzores
Immigrants from Norway
Race
Ancestry
AfghanAfricanAlaska NativeAlaskan AthabascanAlbanianAleutAlsatianAmericanApacheArabArapahoArgentineanArmenianAssyrian/Chaldean/SyriacAustrianBahamianBangladeshiBarbadianBasqueBelgianBelizeanBermudanBhutaneseBlackfeetBolivianBrazilianBritishBritish West IndianBulgarianBurmeseCajunCambodianCanadianCape VerdeanCarpatho RusynCelticCentral AmericanCentral American IndianCherokeeCheyenneChickasawChileanChineseChippewaChoctawColombianColvilleComancheCosta RicanCreeCreekCroatianCrowCubanCypriotCzechCzechoslovakianDanishDelawareDominicanDutchDutch West IndianEastern EuropeanEcuadorianEgyptianEnglishEstonianEthiopianEuropeanFijianFilipinoFinnishFrenchFrench American IndianFrench CanadianGermanGerman RussianGhanaianGreekGuamanian/ChamorroGuatemalanGuyaneseHaitianHmongHonduranHopiHoumaHungarianIcelanderIndian (Asian)IndonesianInupiatIranianIraqiIrishIroquoisIsraeliItalianJamaicanJapaneseJordanianKenyanKiowaKoreanLaotianLatvianLebaneseLiberianLithuanianLumbeeLuxembourgerMacedonianMalaysianMalteseMarshalleseMenomineeMexicanMexican American IndianMongolianMoroccanNative HawaiianNavajoNepaleseNew ZealanderNicaraguanNigerianNorthern EuropeanNorwegianOkinawanOsageOttawaPaiutePakistaniPalestinianPanamanianParaguayanPennsylvania GermanPeruvianPimaPolishPortuguesePotawatomiPuebloPuerto RicanPuget Sound SalishRomanianRussianSalvadoranSamoanScandinavianScotch-IrishScottishSeminoleSenegaleseSerbianShoshoneSierra LeoneanSiouxSlavicSlovakSloveneSomaliSouth AfricanSouth AmericanSouth American IndianSoviet UnionSpaniardSpanishSpanish AmericanSpanish American IndianSri LankanSubsaharan AfricanSudaneseSwedishSwissSyrianTaiwaneseThaiTlingit-HaidaTohono O'OdhamTonganTrinidadian and TobagonianTsimshianTurkishU.S. Virgin IslanderUgandanUkrainianUruguayanUteVenezuelanVietnameseWelshWest IndianYakamaYaquiYugoslavianYumanYup'ikZimbabwean
Immigration
NonimmigrantsImmigrantsAfghanistanAfricaAlbaniaArgentinaArmeniaAsiaAustraliaAustriaBahamasBangladeshBarbadosBelarusBelgiumBelizeBoliviaBosnia and HerzegovinaBrazilBulgariaBurma/MyanmarCabo VerdeCambodiaCameroonCanadaCaribbeanCentral AmericaChileChinaColombiaCongoCosta RicaCroatiaCubaCzechoslovakiaDenmarkDominicaDominican RepublicEastern AfricaEastern AsiaEastern EuropeEcuadorEgyptEl SalvadorEnglandEritreaEthiopiaEuropeFijiFranceGermanyGhanaGreeceGrenadaGuatemalaGuyanaHaitiHondurasHong KongHungaryIndiaIndonesiaIranIraqIrelandIsraelItalyJamaicaJapanJordanKazakhstanKenyaKoreaKuwaitLaosLatin AmericaLatviaLebanonLiberiaLithuaniaMalaysiaMexicoMicronesiaMiddle AfricaMoldovaMoroccoNepalNetherlandsNicaraguaNigeriaNorth AmericaNorth MacedoniaNorthern AfricaNorthern EuropeNorwayOceaniaPakistanPanamaPeruPhilippinesPolandPortugalRomaniaRussiaSaudi ArabiaScotlandSenegalSerbiaSierra LeoneSingaporeSomaliaSouth AfricaSouth AmericaSouth Central AsiaSouth Eastern AsiaSouthern EuropeSpainSri LankaSt. Vincent and the GrenadinesSudanSwedenSwitzerlandSyriaTaiwanThailandTrinidad and TobagoTurkeyUgandaUkraineUruguayUzbekistanVenezuelaVietnamWest IndiesWestern AfricaWestern AsiaWestern EuropeYemenZaireZimbabweAzores
1 or more Vehicles in Household
Income
Poverty
Unemployment
Labor Participation
Family Structure
Vehicle Availability
Education Level
Disability

1 or more Vehicles in Household Comparison

Australians

Immigrants from Norway

Good
Tragic
90.0%
1 OR MORE VEHICLES IN HOUSEHOLD
72.4/ 100
METRIC RATING
156th/ 347
METRIC RANK
88.7%
1 OR MORE VEHICLES IN HOUSEHOLD
5.5/ 100
METRIC RATING
228th/ 347
METRIC RANK

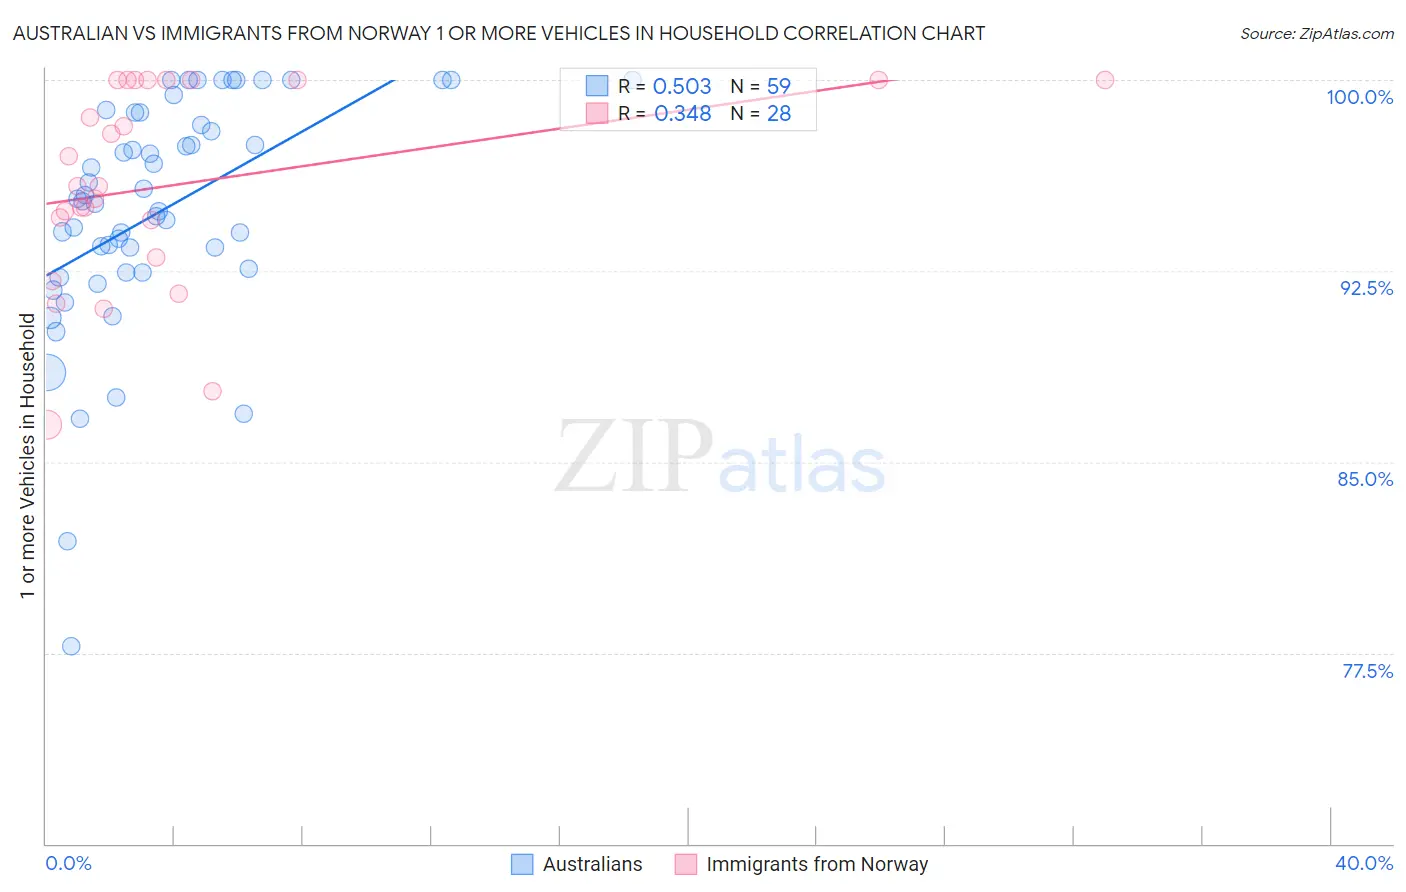
Australian vs Immigrants from Norway 1 or more Vehicles in Household Correlation Chart

The statistical analysis conducted on geographies consisting of 224,001,878 people shows a substantial positive correlation between the proportion of Australians and percentage of households with 1 or more vehicles available in the United States with a correlation coefficient (R) of 0.503 and weighted average of 90.0%. Similarly, the statistical analysis conducted on geographies consisting of 116,609,414 people shows a mild positive correlation between the proportion of Immigrants from Norway and percentage of households with 1 or more vehicles available in the United States with a correlation coefficient (R) of 0.348 and weighted average of 88.7%, a difference of 1.5%.
Australian vs Immigrants from Norway 1 or more Vehicles in Household

1 or more Vehicles in Household Correlation Summary

MeasurementAustralianImmigrants from Norway
Minimum77.7%86.5%
Maximum100.0%100.0%
Range22.3%13.5%
Mean94.8%95.9%
Median95.3%95.8%
Interquartile 25% (IQ1)92.4%93.7%
Interquartile 75% (IQ3)98.7%100.0%
Interquartile Range (IQR)6.3%6.3%
Standard Deviation (Sample)4.6%3.9%
Standard Deviation (Population)4.6%3.9%

Similar Demographics by 1 or more Vehicles in Household

Demographics Similar to Australians by 1 or more Vehicles in Household

In terms of 1 or more vehicles in household, the demographic groups most similar to Australians are Immigrants (90.1%, a difference of 0.020%), Immigrants from Congo (90.0%, a difference of 0.020%), New Zealander (90.1%, a difference of 0.030%), Immigrants from Uganda (90.1%, a difference of 0.030%), and Brazilian (90.0%, a difference of 0.030%).
DemographicsRating | Rank1 or more Vehicles in Household
Immigrants | Nicaragua
76.7
/100
|
#149
Good
90.1%
Immigrants | Micronesia
75.9
/100
|
#150
Good
90.1%
Immigrants | Bosnia and Herzegovina
75.4
/100
|
#151
Good
90.1%
Tlingit-Haida
74.3
/100
|
#152
Good
90.1%
New Zealanders
73.8
/100
|
#153
Good
90.1%
Immigrants | Uganda
73.8
/100
|
#154
Good
90.1%
Immigrants | Immigrants
73.6
/100
|
#155
Good
90.1%
Australians
72.4
/100
|
#156
Good
90.0%
Immigrants | Congo
71.2
/100
|
#157
Good
90.0%
Brazilians
71.0
/100
|
#158
Good
90.0%
South Africans
69.7
/100
|
#159
Good
90.0%
Immigrants | Indonesia
68.8
/100
|
#160
Good
90.0%
Salvadorans
68.7
/100
|
#161
Good
90.0%
Spanish American Indians
67.0
/100
|
#162
Good
89.9%
Immigrants | Austria
65.5
/100
|
#163
Good
89.9%

Demographics Similar to Immigrants from Norway by 1 or more Vehicles in Household

In terms of 1 or more vehicles in household, the demographic groups most similar to Immigrants from Norway are Cheyenne (88.7%, a difference of 0.010%), Ute (88.7%, a difference of 0.010%), Immigrants from Romania (88.7%, a difference of 0.010%), Immigrants from Sierra Leone (88.7%, a difference of 0.030%), and Cree (88.7%, a difference of 0.040%).
DemographicsRating | Rank1 or more Vehicles in Household
Peruvians
7.9
/100
|
#221
Tragic
88.8%
Uruguayans
7.0
/100
|
#222
Tragic
88.8%
Immigrants | South America
7.0
/100
|
#223
Tragic
88.8%
Immigrants | Hong Kong
6.2
/100
|
#224
Tragic
88.7%
Cree
6.0
/100
|
#225
Tragic
88.7%
Cheyenne
5.7
/100
|
#226
Tragic
88.7%
Ute
5.6
/100
|
#227
Tragic
88.7%
Immigrants | Norway
5.5
/100
|
#228
Tragic
88.7%
Immigrants | Romania
5.4
/100
|
#229
Tragic
88.7%
Immigrants | Sierra Leone
5.2
/100
|
#230
Tragic
88.7%
Russians
5.0
/100
|
#231
Tragic
88.7%
Immigrants | Japan
4.9
/100
|
#232
Tragic
88.7%
Houma
4.8
/100
|
#233
Tragic
88.6%
Immigrants | Peru
4.7
/100
|
#234
Tragic
88.6%
Paiute
4.6
/100
|
#235
Tragic
88.6%