Fijian vs Menominee Female Unemployment
COMPARE
Fijian
Menominee
Female Unemployment
Female Unemployment Comparison
Fijians
Menominee
4.7%
FEMALE UNEMPLOYMENT
99.9/ 100
METRIC RATING
21st/ 347
METRIC RANK
7.0%
FEMALE UNEMPLOYMENT
0.0/ 100
METRIC RATING
333rd/ 347
METRIC RANK
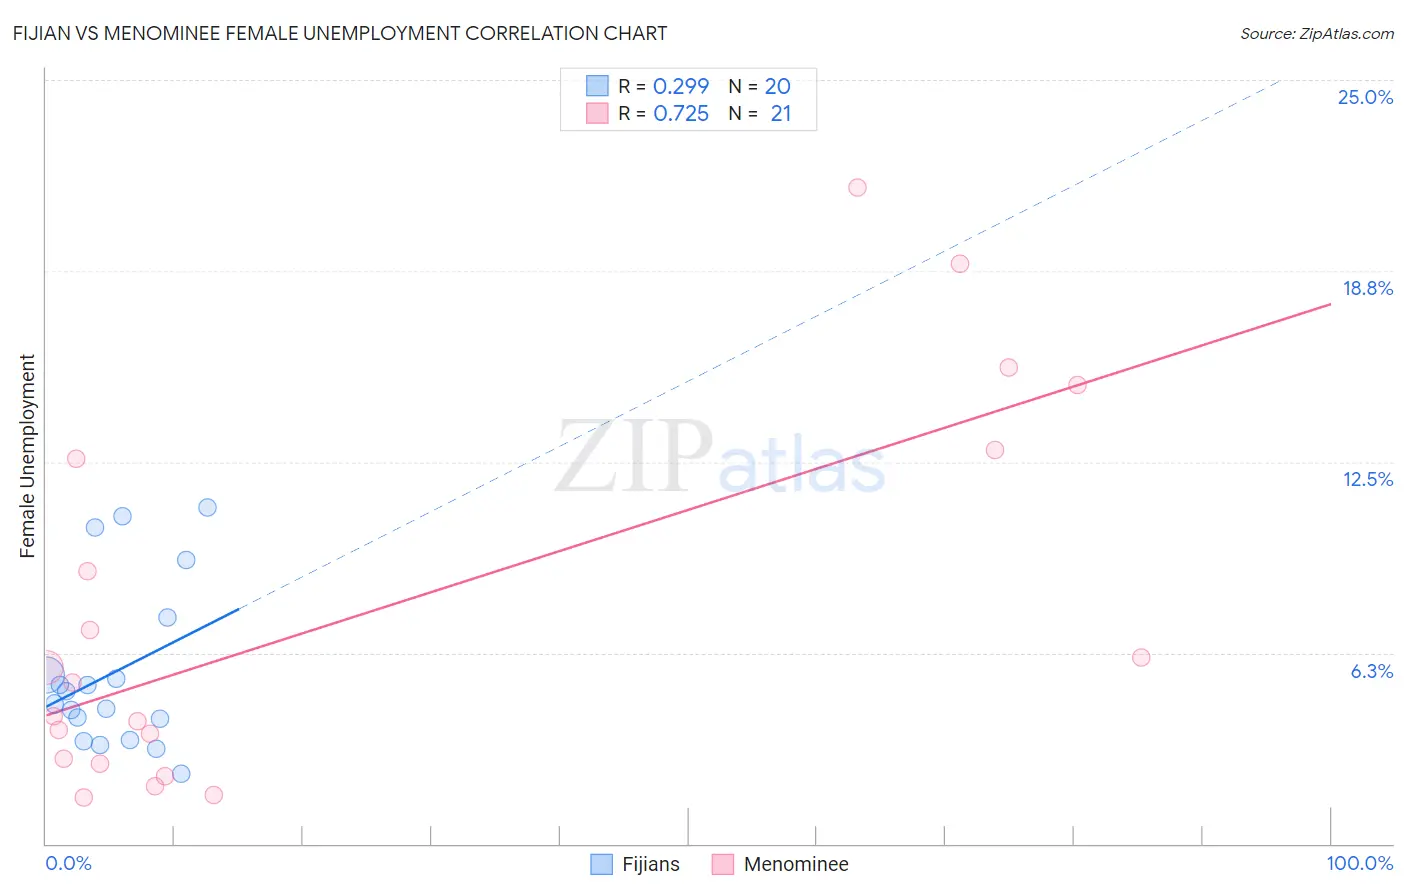
Fijian vs Menominee Female Unemployment Correlation Chart
The statistical analysis conducted on geographies consisting of 55,900,022 people shows a weak positive correlation between the proportion of Fijians and unemploymnet rate among females in the United States with a correlation coefficient (R) of 0.299 and weighted average of 4.7%. Similarly, the statistical analysis conducted on geographies consisting of 45,628,171 people shows a strong positive correlation between the proportion of Menominee and unemploymnet rate among females in the United States with a correlation coefficient (R) of 0.725 and weighted average of 7.0%, a difference of 50.3%.
Female Unemployment Correlation Summary
| Measurement | Fijian | Menominee |
| Minimum | 2.3% | 1.5% |
| Maximum | 11.0% | 21.5% |
| Range | 8.7% | 20.0% |
| Mean | 5.6% | 7.5% |
| Median | 4.8% | 5.3% |
| Interquartile 25% (IQ1) | 3.7% | 2.7% |
| Interquartile 75% (IQ3) | 6.5% | 12.7% |
| Interquartile Range (IQR) | 2.7% | 10.0% |
| Standard Deviation (Sample) | 2.7% | 6.1% |
| Standard Deviation (Population) | 2.6% | 6.0% |
Similar Demographics by Female Unemployment
Demographics Similar to Fijians by Female Unemployment
In terms of female unemployment, the demographic groups most similar to Fijians are Bulgarian (4.7%, a difference of 0.010%), European (4.7%, a difference of 0.020%), Polish (4.7%, a difference of 0.090%), Latvian (4.7%, a difference of 0.10%), and Croatian (4.7%, a difference of 0.25%).
| Demographics | Rating | Rank | Female Unemployment |
| Finns | 100.0 /100 | #14 | Exceptional 4.6% |
| English | 100.0 /100 | #15 | Exceptional 4.6% |
| Carpatho Rusyns | 99.9 /100 | #16 | Exceptional 4.7% |
| Croatians | 99.9 /100 | #17 | Exceptional 4.7% |
| Latvians | 99.9 /100 | #18 | Exceptional 4.7% |
| Poles | 99.9 /100 | #19 | Exceptional 4.7% |
| Bulgarians | 99.9 /100 | #20 | Exceptional 4.7% |
| Fijians | 99.9 /100 | #21 | Exceptional 4.7% |
| Europeans | 99.9 /100 | #22 | Exceptional 4.7% |
| Scottish | 99.9 /100 | #23 | Exceptional 4.7% |
| Welsh | 99.9 /100 | #24 | Exceptional 4.7% |
| Immigrants | India | 99.9 /100 | #25 | Exceptional 4.7% |
| Immigrants | Bosnia and Herzegovina | 99.9 /100 | #26 | Exceptional 4.7% |
| British | 99.9 /100 | #27 | Exceptional 4.7% |
| Irish | 99.9 /100 | #28 | Exceptional 4.7% |
Demographics Similar to Menominee by Female Unemployment
In terms of female unemployment, the demographic groups most similar to Menominee are Sioux (7.0%, a difference of 0.020%), Immigrants from Armenia (7.1%, a difference of 0.41%), Dominican (7.2%, a difference of 1.8%), Immigrants from Dominican Republic (7.2%, a difference of 2.5%), and Navajo (7.3%, a difference of 3.5%).
| Demographics | Rating | Rank | Female Unemployment |
| Natives/Alaskans | 0.0 /100 | #326 | Tragic 6.6% |
| Alaska Natives | 0.0 /100 | #327 | Tragic 6.6% |
| Guyanese | 0.0 /100 | #328 | Tragic 6.7% |
| Immigrants | Guyana | 0.0 /100 | #329 | Tragic 6.7% |
| Yakama | 0.0 /100 | #330 | Tragic 6.7% |
| Paiute | 0.0 /100 | #331 | Tragic 6.8% |
| Sioux | 0.0 /100 | #332 | Tragic 7.0% |
| Menominee | 0.0 /100 | #333 | Tragic 7.0% |
| Immigrants | Armenia | 0.0 /100 | #334 | Tragic 7.1% |
| Dominicans | 0.0 /100 | #335 | Tragic 7.2% |
| Immigrants | Dominican Republic | 0.0 /100 | #336 | Tragic 7.2% |
| Navajo | 0.0 /100 | #337 | Tragic 7.3% |
| Tohono O'odham | 0.0 /100 | #338 | Tragic 7.7% |
| Immigrants | Yemen | 0.0 /100 | #339 | Tragic 7.8% |
| Hopi | 0.0 /100 | #340 | Tragic 8.1% |