Somali vs Menominee Child Poverty Under the Age of 16
COMPARE
Somali
Menominee
Child Poverty Under the Age of 16
Child Poverty Under the Age of 16 Comparison
Somalis
Menominee
21.0%
CHILD POVERTY UNDER THE AGE OF 16
0.0/ 100
METRIC RATING
304th/ 347
METRIC RANK
23.0%
CHILD POVERTY UNDER THE AGE OF 16
0.0/ 100
METRIC RATING
327th/ 347
METRIC RANK
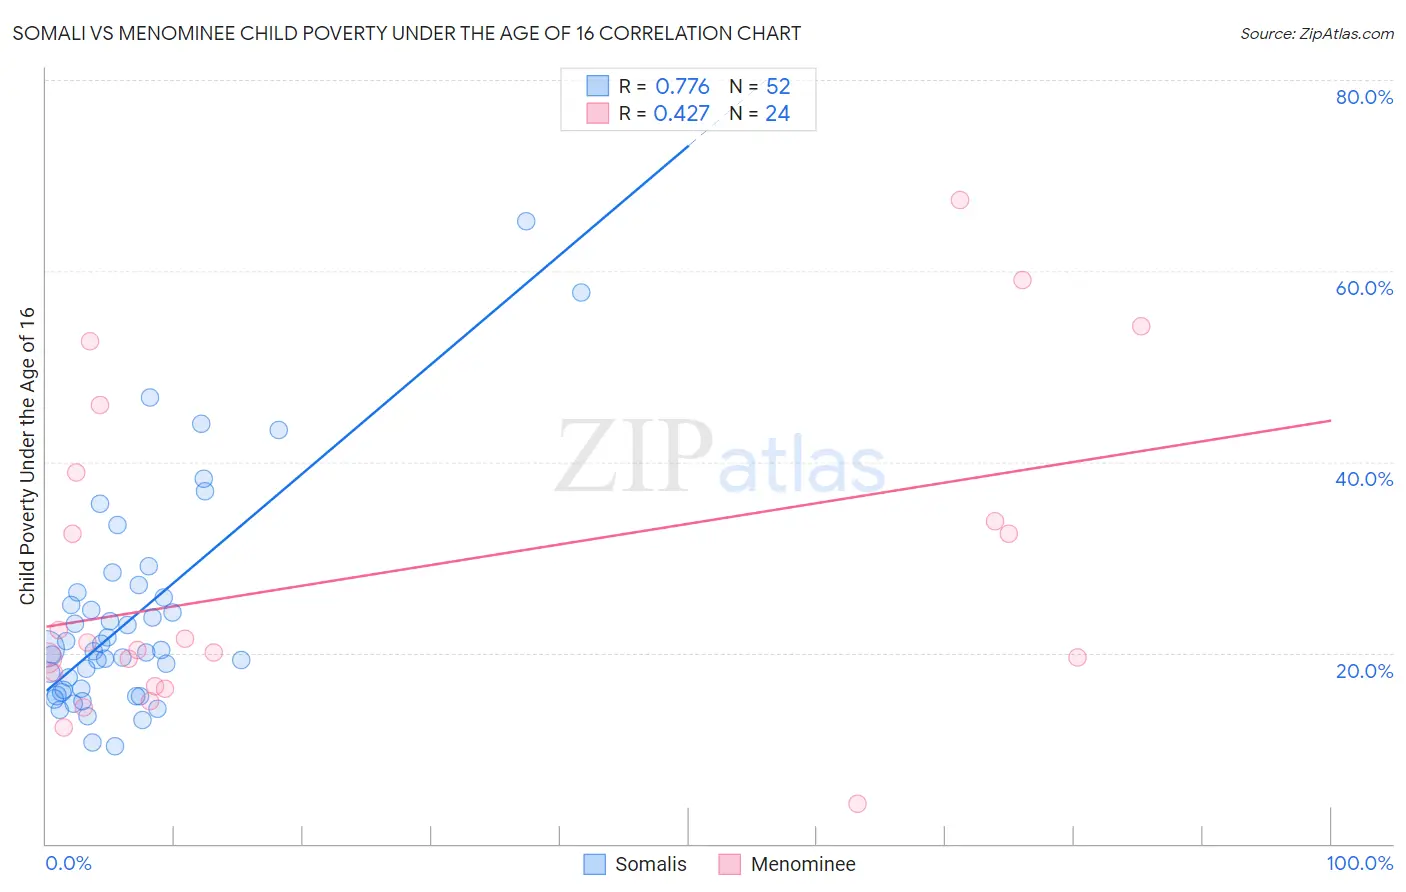
Somali vs Menominee Child Poverty Under the Age of 16 Correlation Chart
The statistical analysis conducted on geographies consisting of 99,170,340 people shows a strong positive correlation between the proportion of Somalis and poverty level among children under the age of 16 in the United States with a correlation coefficient (R) of 0.776 and weighted average of 21.0%. Similarly, the statistical analysis conducted on geographies consisting of 45,715,649 people shows a moderate positive correlation between the proportion of Menominee and poverty level among children under the age of 16 in the United States with a correlation coefficient (R) of 0.427 and weighted average of 23.0%, a difference of 9.2%.
Child Poverty Under the Age of 16 Correlation Summary
| Measurement | Somali | Menominee |
| Minimum | 10.2% | 4.2% |
| Maximum | 65.2% | 67.4% |
| Range | 55.1% | 63.2% |
| Mean | 23.7% | 28.2% |
| Median | 20.2% | 20.7% |
| Interquartile 25% (IQ1) | 16.0% | 17.3% |
| Interquartile 75% (IQ3) | 26.1% | 36.4% |
| Interquartile Range (IQR) | 10.1% | 19.1% |
| Standard Deviation (Sample) | 11.3% | 16.6% |
| Standard Deviation (Population) | 11.2% | 16.3% |
Similar Demographics by Child Poverty Under the Age of 16
Demographics Similar to Somalis by Child Poverty Under the Age of 16
In terms of child poverty under the age of 16, the demographic groups most similar to Somalis are Choctaw (21.0%, a difference of 0.050%), Immigrants from Bahamas (21.0%, a difference of 0.090%), Immigrants from Grenada (21.0%, a difference of 0.33%), Indonesian (21.0%, a difference of 0.37%), and Seminole (21.1%, a difference of 0.47%).
| Demographics | Rating | Rank | Child Poverty Under the Age of 16 |
| Hispanics or Latinos | 0.0 /100 | #297 | Tragic 20.8% |
| Arapaho | 0.0 /100 | #298 | Tragic 20.8% |
| Immigrants | Haiti | 0.0 /100 | #299 | Tragic 20.9% |
| Indonesians | 0.0 /100 | #300 | Tragic 21.0% |
| Immigrants | Grenada | 0.0 /100 | #301 | Tragic 21.0% |
| Immigrants | Bahamas | 0.0 /100 | #302 | Tragic 21.0% |
| Choctaw | 0.0 /100 | #303 | Tragic 21.0% |
| Somalis | 0.0 /100 | #304 | Tragic 21.0% |
| Seminole | 0.0 /100 | #305 | Tragic 21.1% |
| Guatemalans | 0.0 /100 | #306 | Tragic 21.2% |
| Immigrants | Central America | 0.0 /100 | #307 | Tragic 21.3% |
| British West Indians | 0.0 /100 | #308 | Tragic 21.3% |
| Immigrants | Mexico | 0.0 /100 | #309 | Tragic 21.5% |
| Bahamians | 0.0 /100 | #310 | Tragic 21.5% |
| Dutch West Indians | 0.0 /100 | #311 | Tragic 21.5% |
Demographics Similar to Menominee by Child Poverty Under the Age of 16
In terms of child poverty under the age of 16, the demographic groups most similar to Menominee are Colville (23.0%, a difference of 0.38%), Immigrants from Honduras (22.7%, a difference of 1.1%), Immigrants from Congo (22.5%, a difference of 1.9%), Central American Indian (22.5%, a difference of 2.1%), and Paiute (22.4%, a difference of 2.4%).
| Demographics | Rating | Rank | Child Poverty Under the Age of 16 |
| Cajuns | 0.0 /100 | #320 | Tragic 22.1% |
| Kiowa | 0.0 /100 | #321 | Tragic 22.2% |
| Hondurans | 0.0 /100 | #322 | Tragic 22.2% |
| Paiute | 0.0 /100 | #323 | Tragic 22.4% |
| Central American Indians | 0.0 /100 | #324 | Tragic 22.5% |
| Immigrants | Congo | 0.0 /100 | #325 | Tragic 22.5% |
| Immigrants | Honduras | 0.0 /100 | #326 | Tragic 22.7% |
| Menominee | 0.0 /100 | #327 | Tragic 23.0% |
| Colville | 0.0 /100 | #328 | Tragic 23.0% |
| Dominicans | 0.0 /100 | #329 | Tragic 23.8% |
| Natives/Alaskans | 0.0 /100 | #330 | Tragic 23.8% |
| Apache | 0.0 /100 | #331 | Tragic 23.8% |
| Pueblo | 0.0 /100 | #332 | Tragic 23.9% |
| Immigrants | Dominican Republic | 0.0 /100 | #333 | Tragic 24.0% |
| Blacks/African Americans | 0.0 /100 | #334 | Tragic 24.4% |