Korean vs New Zealander Female Unemployment
COMPARE
Korean
New Zealander
Female Unemployment
Female Unemployment Comparison
Koreans
New Zealanders
5.4%
FEMALE UNEMPLOYMENT
13.4/ 100
METRIC RATING
209th/ 347
METRIC RANK
5.0%
FEMALE UNEMPLOYMENT
97.4/ 100
METRIC RATING
80th/ 347
METRIC RANK
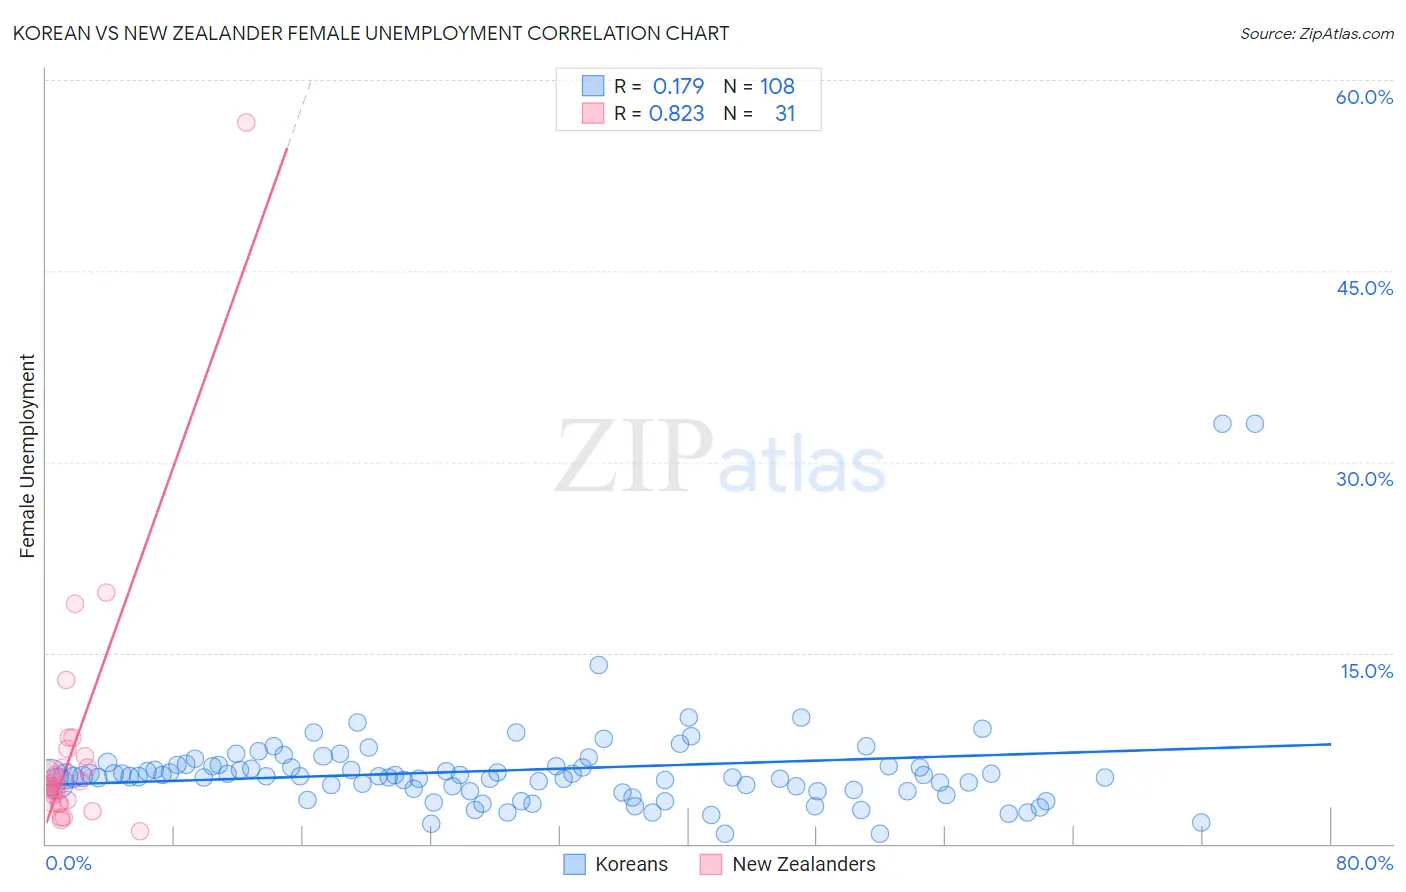
Korean vs New Zealander Female Unemployment Correlation Chart
The statistical analysis conducted on geographies consisting of 506,042,019 people shows a poor positive correlation between the proportion of Koreans and unemploymnet rate among females in the United States with a correlation coefficient (R) of 0.179 and weighted average of 5.4%. Similarly, the statistical analysis conducted on geographies consisting of 106,766,859 people shows a very strong positive correlation between the proportion of New Zealanders and unemploymnet rate among females in the United States with a correlation coefficient (R) of 0.823 and weighted average of 5.0%, a difference of 8.7%.
Female Unemployment Correlation Summary
| Measurement | Korean | New Zealander |
| Minimum | 0.80% | 1.0% |
| Maximum | 33.0% | 56.7% |
| Range | 32.2% | 55.7% |
| Mean | 5.8% | 7.4% |
| Median | 5.3% | 4.7% |
| Interquartile 25% (IQ1) | 4.2% | 3.2% |
| Interquartile 75% (IQ3) | 6.1% | 6.9% |
| Interquartile Range (IQR) | 1.9% | 3.7% |
| Standard Deviation (Sample) | 4.3% | 10.1% |
| Standard Deviation (Population) | 4.2% | 9.9% |
Similar Demographics by Female Unemployment
Demographics Similar to Koreans by Female Unemployment
In terms of female unemployment, the demographic groups most similar to Koreans are Immigrants from Costa Rica (5.4%, a difference of 0.040%), Choctaw (5.4%, a difference of 0.15%), Creek (5.4%, a difference of 0.24%), Ottawa (5.4%, a difference of 0.24%), and Uruguayan (5.4%, a difference of 0.26%).
| Demographics | Rating | Rank | Female Unemployment |
| Iroquois | 20.8 /100 | #202 | Fair 5.4% |
| Immigrants | South Eastern Asia | 20.3 /100 | #203 | Fair 5.4% |
| Immigrants | Israel | 19.7 /100 | #204 | Poor 5.4% |
| Immigrants | Afghanistan | 18.9 /100 | #205 | Poor 5.4% |
| Immigrants | Brazil | 18.8 /100 | #206 | Poor 5.4% |
| Creek | 15.4 /100 | #207 | Poor 5.4% |
| Immigrants | Costa Rica | 13.7 /100 | #208 | Poor 5.4% |
| Koreans | 13.4 /100 | #209 | Poor 5.4% |
| Choctaw | 12.3 /100 | #210 | Poor 5.4% |
| Ottawa | 11.6 /100 | #211 | Poor 5.4% |
| Uruguayans | 11.4 /100 | #212 | Poor 5.4% |
| Samoans | 10.6 /100 | #213 | Poor 5.4% |
| Seminole | 10.3 /100 | #214 | Poor 5.4% |
| Immigrants | Nicaragua | 10.2 /100 | #215 | Poor 5.4% |
| Comanche | 10.0 /100 | #216 | Poor 5.4% |
Demographics Similar to New Zealanders by Female Unemployment
In terms of female unemployment, the demographic groups most similar to New Zealanders are Filipino (5.0%, a difference of 0.020%), Immigrants from Australia (5.0%, a difference of 0.070%), Immigrants from Serbia (5.0%, a difference of 0.090%), Turkish (5.0%, a difference of 0.12%), and Canadian (5.0%, a difference of 0.13%).
| Demographics | Rating | Rank | Female Unemployment |
| Russians | 98.0 /100 | #73 | Exceptional 5.0% |
| Immigrants | Bolivia | 98.0 /100 | #74 | Exceptional 5.0% |
| Immigrants | Singapore | 98.0 /100 | #75 | Exceptional 5.0% |
| Immigrants | Venezuela | 97.9 /100 | #76 | Exceptional 5.0% |
| Mongolians | 97.8 /100 | #77 | Exceptional 5.0% |
| Immigrants | Netherlands | 97.8 /100 | #78 | Exceptional 5.0% |
| Turks | 97.6 /100 | #79 | Exceptional 5.0% |
| New Zealanders | 97.4 /100 | #80 | Exceptional 5.0% |
| Filipinos | 97.3 /100 | #81 | Exceptional 5.0% |
| Immigrants | Australia | 97.3 /100 | #82 | Exceptional 5.0% |
| Immigrants | Serbia | 97.2 /100 | #83 | Exceptional 5.0% |
| Canadians | 97.2 /100 | #84 | Exceptional 5.0% |
| Ukrainians | 97.1 /100 | #85 | Exceptional 5.0% |
| Bolivians | 97.1 /100 | #86 | Exceptional 5.0% |
| Venezuelans | 96.9 /100 | #87 | Exceptional 5.0% |