Korean vs Immigrants from Denmark Female Unemployment
COMPARE
Korean
Immigrants from Denmark
Female Unemployment
Female Unemployment Comparison
Koreans
Immigrants from Denmark
5.4%
FEMALE UNEMPLOYMENT
13.4/ 100
METRIC RATING
209th/ 347
METRIC RANK
5.2%
FEMALE UNEMPLOYMENT
55.0/ 100
METRIC RATING
171st/ 347
METRIC RANK
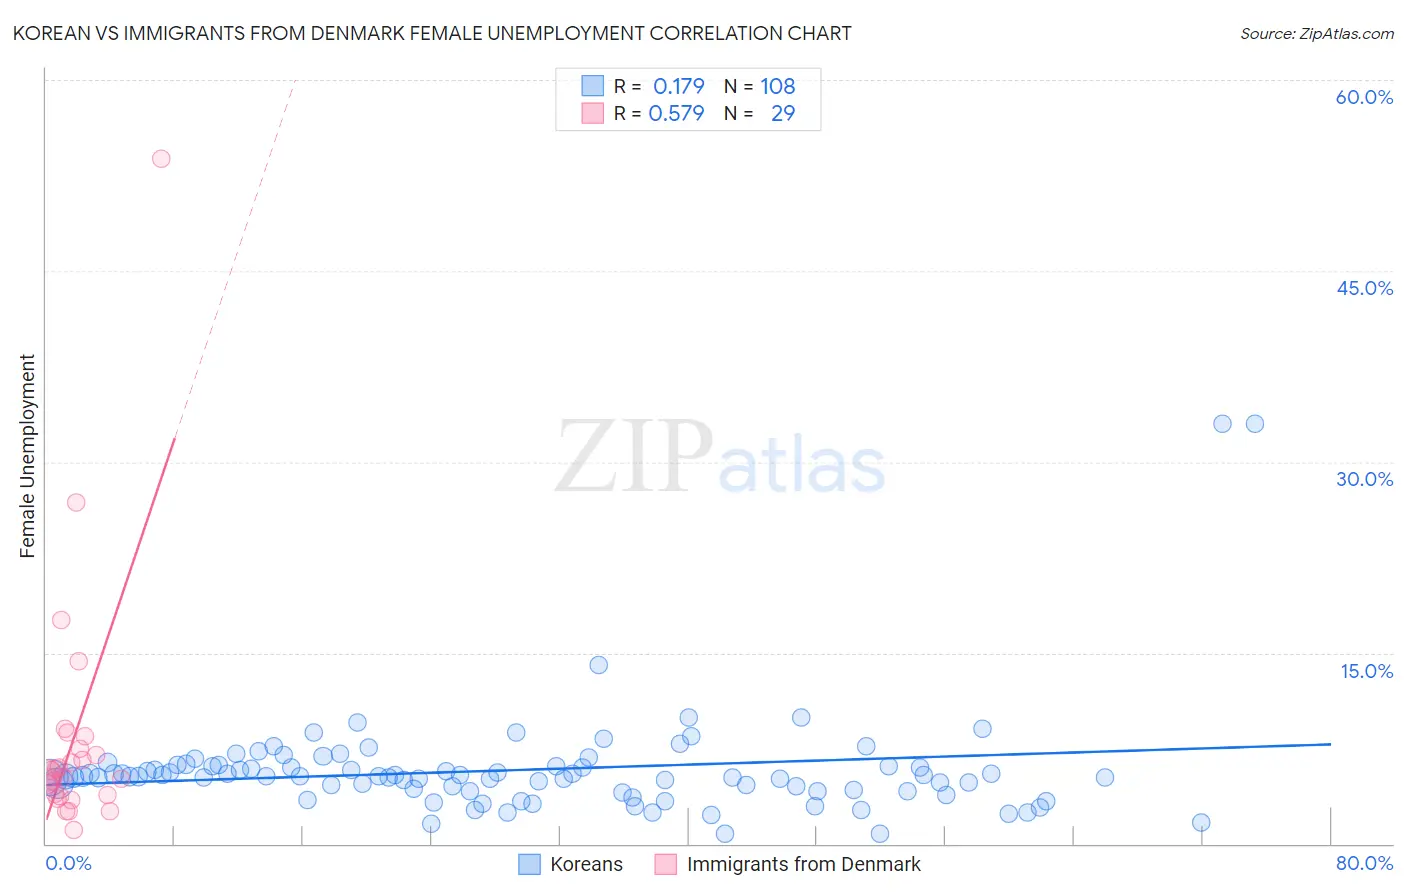
Korean vs Immigrants from Denmark Female Unemployment Correlation Chart
The statistical analysis conducted on geographies consisting of 506,042,019 people shows a poor positive correlation between the proportion of Koreans and unemploymnet rate among females in the United States with a correlation coefficient (R) of 0.179 and weighted average of 5.4%. Similarly, the statistical analysis conducted on geographies consisting of 136,180,001 people shows a substantial positive correlation between the proportion of Immigrants from Denmark and unemploymnet rate among females in the United States with a correlation coefficient (R) of 0.579 and weighted average of 5.2%, a difference of 3.1%.
Female Unemployment Correlation Summary
| Measurement | Korean | Immigrants from Denmark |
| Minimum | 0.80% | 1.1% |
| Maximum | 33.0% | 53.8% |
| Range | 32.2% | 52.7% |
| Mean | 5.8% | 8.3% |
| Median | 5.3% | 5.4% |
| Interquartile 25% (IQ1) | 4.2% | 3.8% |
| Interquartile 75% (IQ3) | 6.1% | 8.0% |
| Interquartile Range (IQR) | 1.9% | 4.2% |
| Standard Deviation (Sample) | 4.3% | 10.1% |
| Standard Deviation (Population) | 4.2% | 10.0% |
Similar Demographics by Female Unemployment
Demographics Similar to Koreans by Female Unemployment
In terms of female unemployment, the demographic groups most similar to Koreans are Immigrants from Costa Rica (5.4%, a difference of 0.040%), Choctaw (5.4%, a difference of 0.15%), Creek (5.4%, a difference of 0.24%), Ottawa (5.4%, a difference of 0.24%), and Uruguayan (5.4%, a difference of 0.26%).
| Demographics | Rating | Rank | Female Unemployment |
| Iroquois | 20.8 /100 | #202 | Fair 5.4% |
| Immigrants | South Eastern Asia | 20.3 /100 | #203 | Fair 5.4% |
| Immigrants | Israel | 19.7 /100 | #204 | Poor 5.4% |
| Immigrants | Afghanistan | 18.9 /100 | #205 | Poor 5.4% |
| Immigrants | Brazil | 18.8 /100 | #206 | Poor 5.4% |
| Creek | 15.4 /100 | #207 | Poor 5.4% |
| Immigrants | Costa Rica | 13.7 /100 | #208 | Poor 5.4% |
| Koreans | 13.4 /100 | #209 | Poor 5.4% |
| Choctaw | 12.3 /100 | #210 | Poor 5.4% |
| Ottawa | 11.6 /100 | #211 | Poor 5.4% |
| Uruguayans | 11.4 /100 | #212 | Poor 5.4% |
| Samoans | 10.6 /100 | #213 | Poor 5.4% |
| Seminole | 10.3 /100 | #214 | Poor 5.4% |
| Immigrants | Nicaragua | 10.2 /100 | #215 | Poor 5.4% |
| Comanche | 10.0 /100 | #216 | Poor 5.4% |
Demographics Similar to Immigrants from Denmark by Female Unemployment
In terms of female unemployment, the demographic groups most similar to Immigrants from Denmark are Spanish (5.2%, a difference of 0.050%), Immigrants from Chile (5.2%, a difference of 0.24%), Immigrants from Uganda (5.3%, a difference of 0.26%), Sri Lankan (5.2%, a difference of 0.27%), and Iranian (5.3%, a difference of 0.28%).
| Demographics | Rating | Rank | Female Unemployment |
| Bangladeshis | 64.3 /100 | #164 | Good 5.2% |
| Syrians | 62.8 /100 | #165 | Good 5.2% |
| Native Hawaiians | 62.7 /100 | #166 | Good 5.2% |
| Immigrants | Thailand | 62.1 /100 | #167 | Good 5.2% |
| Sri Lankans | 59.4 /100 | #168 | Average 5.2% |
| Immigrants | Chile | 59.0 /100 | #169 | Average 5.2% |
| Spanish | 55.9 /100 | #170 | Average 5.2% |
| Immigrants | Denmark | 55.0 /100 | #171 | Average 5.2% |
| Immigrants | Uganda | 50.7 /100 | #172 | Average 5.3% |
| Iranians | 50.4 /100 | #173 | Average 5.3% |
| Immigrants | Poland | 50.0 /100 | #174 | Average 5.3% |
| Immigrants | Laos | 47.5 /100 | #175 | Average 5.3% |
| Immigrants | Vietnam | 47.5 /100 | #176 | Average 5.3% |
| Immigrants | Morocco | 47.4 /100 | #177 | Average 5.3% |
| Immigrants | Southern Europe | 46.2 /100 | #178 | Average 5.3% |