Cree vs New Zealander Female Unemployment
COMPARE
Cree
New Zealander
Female Unemployment
Female Unemployment Comparison
Cree
New Zealanders
5.6%
FEMALE UNEMPLOYMENT
1.0/ 100
METRIC RATING
248th/ 347
METRIC RANK
5.0%
FEMALE UNEMPLOYMENT
97.4/ 100
METRIC RATING
80th/ 347
METRIC RANK
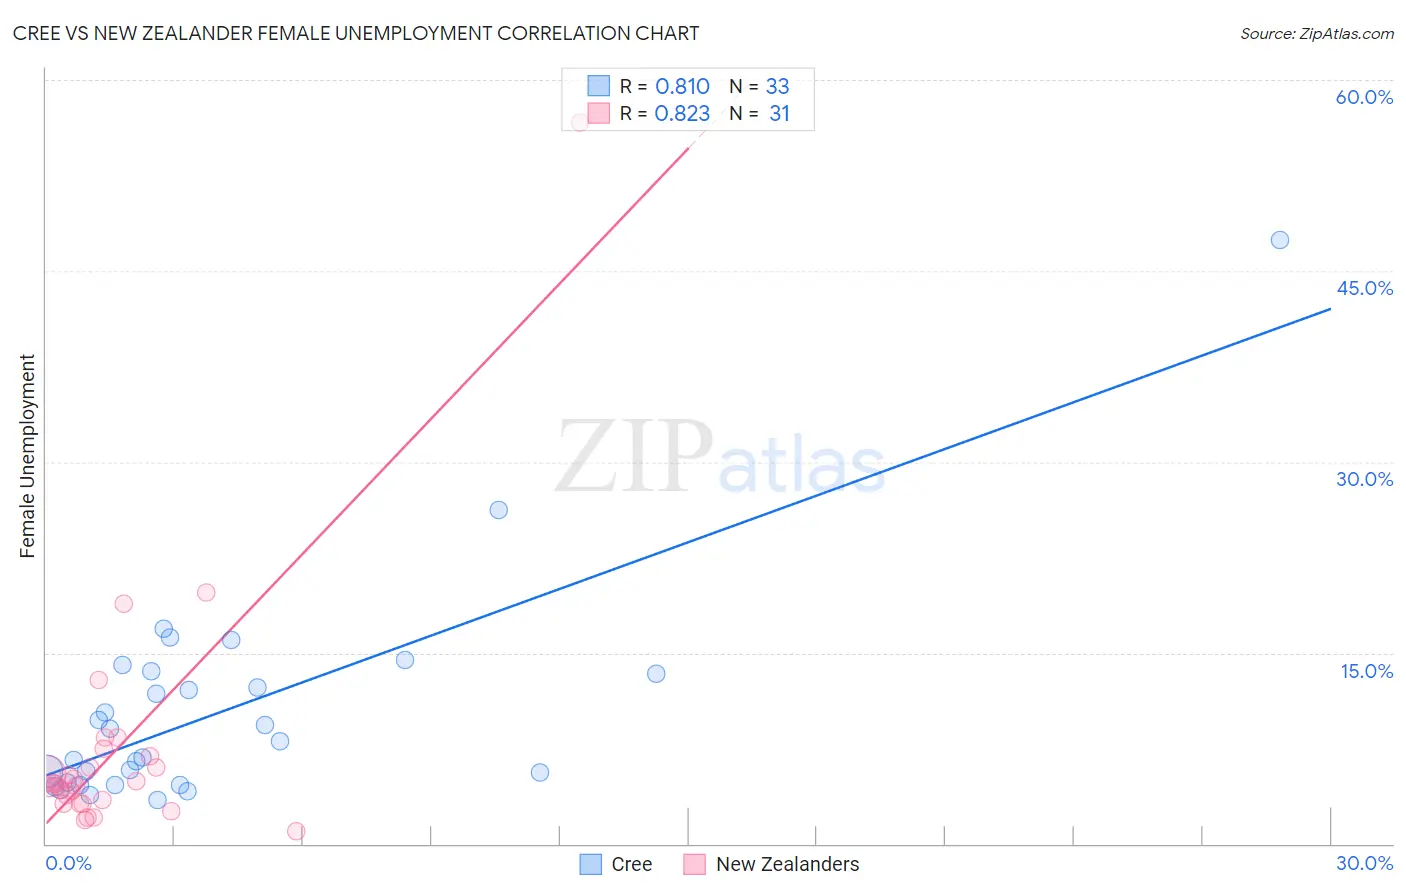
Cree vs New Zealander Female Unemployment Correlation Chart
The statistical analysis conducted on geographies consisting of 76,053,409 people shows a very strong positive correlation between the proportion of Cree and unemploymnet rate among females in the United States with a correlation coefficient (R) of 0.810 and weighted average of 5.6%. Similarly, the statistical analysis conducted on geographies consisting of 106,766,859 people shows a very strong positive correlation between the proportion of New Zealanders and unemploymnet rate among females in the United States with a correlation coefficient (R) of 0.823 and weighted average of 5.0%, a difference of 13.0%.
Female Unemployment Correlation Summary
| Measurement | Cree | New Zealander |
| Minimum | 3.4% | 1.0% |
| Maximum | 47.4% | 56.7% |
| Range | 44.0% | 55.7% |
| Mean | 10.4% | 7.4% |
| Median | 8.1% | 4.7% |
| Interquartile 25% (IQ1) | 4.7% | 3.2% |
| Interquartile 75% (IQ3) | 13.5% | 6.9% |
| Interquartile Range (IQR) | 8.8% | 3.7% |
| Standard Deviation (Sample) | 8.4% | 10.1% |
| Standard Deviation (Population) | 8.3% | 9.9% |
Similar Demographics by Female Unemployment
Demographics Similar to Cree by Female Unemployment
In terms of female unemployment, the demographic groups most similar to Cree are Immigrants from Uzbekistan (5.6%, a difference of 0.040%), Immigrants from Western Asia (5.6%, a difference of 0.16%), Japanese (5.6%, a difference of 0.24%), Immigrants from Syria (5.6%, a difference of 0.33%), and Assyrian/Chaldean/Syriac (5.6%, a difference of 0.39%).
| Demographics | Rating | Rank | Female Unemployment |
| South American Indians | 2.8 /100 | #241 | Tragic 5.5% |
| Marshallese | 2.3 /100 | #242 | Tragic 5.6% |
| Spanish Americans | 2.2 /100 | #243 | Tragic 5.6% |
| Immigrants | Liberia | 1.5 /100 | #244 | Tragic 5.6% |
| Guamanians/Chamorros | 1.4 /100 | #245 | Tragic 5.6% |
| Japanese | 1.2 /100 | #246 | Tragic 5.6% |
| Immigrants | Western Asia | 1.1 /100 | #247 | Tragic 5.6% |
| Cree | 1.0 /100 | #248 | Tragic 5.6% |
| Immigrants | Uzbekistan | 1.0 /100 | #249 | Tragic 5.6% |
| Immigrants | Syria | 0.8 /100 | #250 | Tragic 5.6% |
| Assyrians/Chaldeans/Syriacs | 0.8 /100 | #251 | Tragic 5.6% |
| Cajuns | 0.7 /100 | #252 | Tragic 5.7% |
| Immigrants | Sierra Leone | 0.6 /100 | #253 | Tragic 5.7% |
| Immigrants | Immigrants | 0.6 /100 | #254 | Tragic 5.7% |
| Immigrants | Cameroon | 0.6 /100 | #255 | Tragic 5.7% |
Demographics Similar to New Zealanders by Female Unemployment
In terms of female unemployment, the demographic groups most similar to New Zealanders are Filipino (5.0%, a difference of 0.020%), Immigrants from Australia (5.0%, a difference of 0.070%), Immigrants from Serbia (5.0%, a difference of 0.090%), Turkish (5.0%, a difference of 0.12%), and Canadian (5.0%, a difference of 0.13%).
| Demographics | Rating | Rank | Female Unemployment |
| Russians | 98.0 /100 | #73 | Exceptional 5.0% |
| Immigrants | Bolivia | 98.0 /100 | #74 | Exceptional 5.0% |
| Immigrants | Singapore | 98.0 /100 | #75 | Exceptional 5.0% |
| Immigrants | Venezuela | 97.9 /100 | #76 | Exceptional 5.0% |
| Mongolians | 97.8 /100 | #77 | Exceptional 5.0% |
| Immigrants | Netherlands | 97.8 /100 | #78 | Exceptional 5.0% |
| Turks | 97.6 /100 | #79 | Exceptional 5.0% |
| New Zealanders | 97.4 /100 | #80 | Exceptional 5.0% |
| Filipinos | 97.3 /100 | #81 | Exceptional 5.0% |
| Immigrants | Australia | 97.3 /100 | #82 | Exceptional 5.0% |
| Immigrants | Serbia | 97.2 /100 | #83 | Exceptional 5.0% |
| Canadians | 97.2 /100 | #84 | Exceptional 5.0% |
| Ukrainians | 97.1 /100 | #85 | Exceptional 5.0% |
| Bolivians | 97.1 /100 | #86 | Exceptional 5.0% |
| Venezuelans | 96.9 /100 | #87 | Exceptional 5.0% |