Korean vs Indian (Asian) Female Unemployment
COMPARE
Korean
Indian (Asian)
Female Unemployment
Female Unemployment Comparison
Koreans
Indians (Asian)
5.4%
FEMALE UNEMPLOYMENT
13.4/ 100
METRIC RATING
209th/ 347
METRIC RANK
5.1%
FEMALE UNEMPLOYMENT
84.2/ 100
METRIC RATING
136th/ 347
METRIC RANK
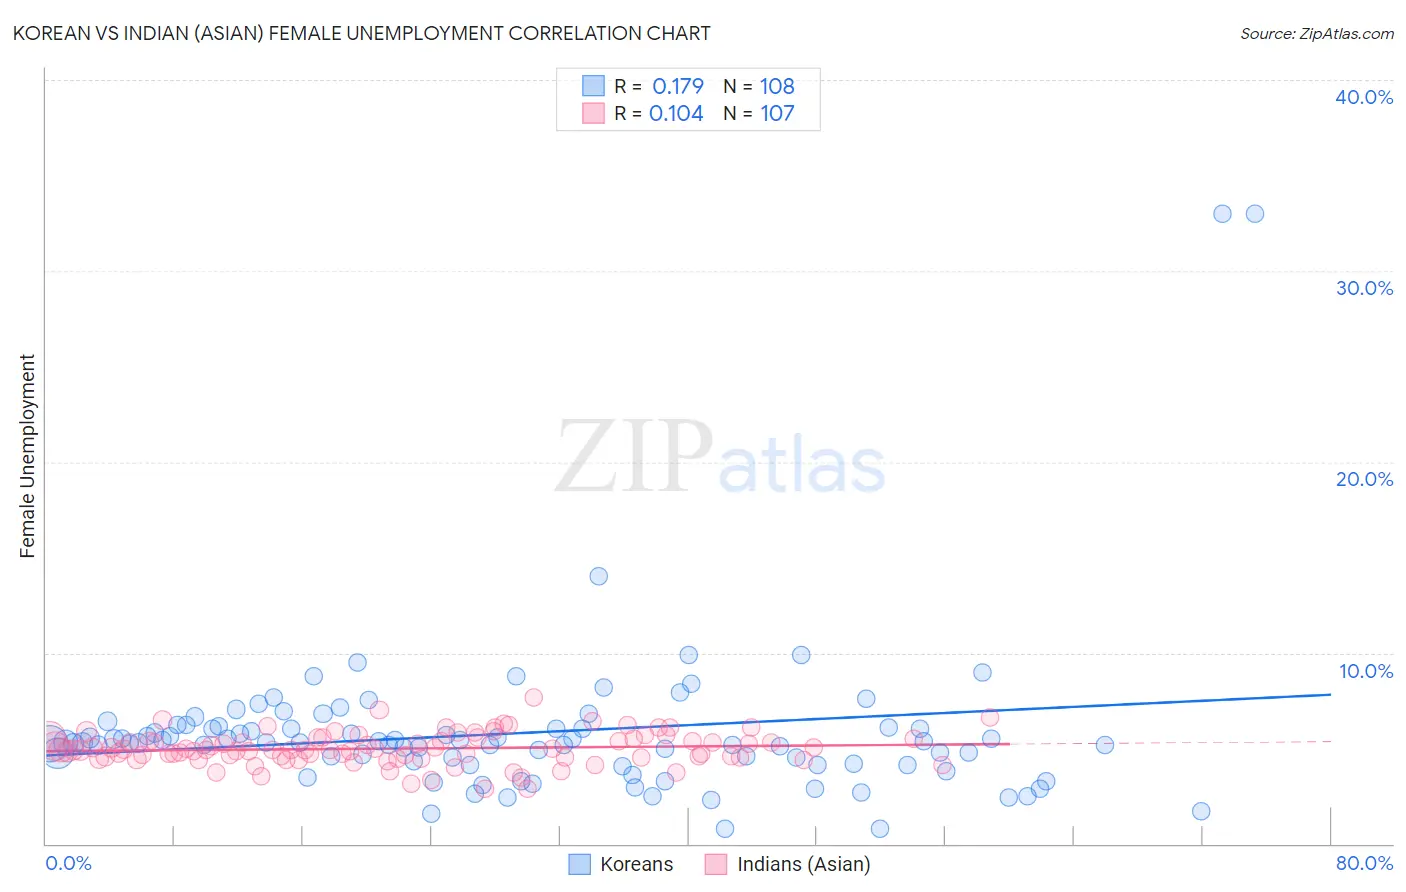
Korean vs Indian (Asian) Female Unemployment Correlation Chart
The statistical analysis conducted on geographies consisting of 506,042,019 people shows a poor positive correlation between the proportion of Koreans and unemploymnet rate among females in the United States with a correlation coefficient (R) of 0.179 and weighted average of 5.4%. Similarly, the statistical analysis conducted on geographies consisting of 491,024,006 people shows a poor positive correlation between the proportion of Indians (Asian) and unemploymnet rate among females in the United States with a correlation coefficient (R) of 0.104 and weighted average of 5.1%, a difference of 5.4%.
Female Unemployment Correlation Summary
| Measurement | Korean | Indian (Asian) |
| Minimum | 0.80% | 2.9% |
| Maximum | 33.0% | 7.6% |
| Range | 32.2% | 4.8% |
| Mean | 5.8% | 5.0% |
| Median | 5.3% | 4.9% |
| Interquartile 25% (IQ1) | 4.2% | 4.5% |
| Interquartile 75% (IQ3) | 6.1% | 5.5% |
| Interquartile Range (IQR) | 1.9% | 0.98% |
| Standard Deviation (Sample) | 4.3% | 0.84% |
| Standard Deviation (Population) | 4.2% | 0.84% |
Similar Demographics by Female Unemployment
Demographics Similar to Koreans by Female Unemployment
In terms of female unemployment, the demographic groups most similar to Koreans are Immigrants from Costa Rica (5.4%, a difference of 0.040%), Choctaw (5.4%, a difference of 0.15%), Creek (5.4%, a difference of 0.24%), Ottawa (5.4%, a difference of 0.24%), and Uruguayan (5.4%, a difference of 0.26%).
| Demographics | Rating | Rank | Female Unemployment |
| Iroquois | 20.8 /100 | #202 | Fair 5.4% |
| Immigrants | South Eastern Asia | 20.3 /100 | #203 | Fair 5.4% |
| Immigrants | Israel | 19.7 /100 | #204 | Poor 5.4% |
| Immigrants | Afghanistan | 18.9 /100 | #205 | Poor 5.4% |
| Immigrants | Brazil | 18.8 /100 | #206 | Poor 5.4% |
| Creek | 15.4 /100 | #207 | Poor 5.4% |
| Immigrants | Costa Rica | 13.7 /100 | #208 | Poor 5.4% |
| Koreans | 13.4 /100 | #209 | Poor 5.4% |
| Choctaw | 12.3 /100 | #210 | Poor 5.4% |
| Ottawa | 11.6 /100 | #211 | Poor 5.4% |
| Uruguayans | 11.4 /100 | #212 | Poor 5.4% |
| Samoans | 10.6 /100 | #213 | Poor 5.4% |
| Seminole | 10.3 /100 | #214 | Poor 5.4% |
| Immigrants | Nicaragua | 10.2 /100 | #215 | Poor 5.4% |
| Comanche | 10.0 /100 | #216 | Poor 5.4% |
Demographics Similar to Indians (Asian) by Female Unemployment
In terms of female unemployment, the demographic groups most similar to Indians (Asian) are Pakistani (5.1%, a difference of 0.040%), Immigrants from Eritrea (5.1%, a difference of 0.050%), Immigrants from Latvia (5.1%, a difference of 0.050%), Immigrants from Hong Kong (5.1%, a difference of 0.070%), and Immigrants from Sri Lanka (5.1%, a difference of 0.090%).
| Demographics | Rating | Rank | Female Unemployment |
| Ethiopians | 85.7 /100 | #129 | Excellent 5.1% |
| Maltese | 85.5 /100 | #130 | Excellent 5.1% |
| Immigrants | Ethiopia | 85.4 /100 | #131 | Excellent 5.1% |
| Immigrants | Sri Lanka | 85.0 /100 | #132 | Excellent 5.1% |
| Immigrants | Hong Kong | 84.8 /100 | #133 | Excellent 5.1% |
| Immigrants | Eritrea | 84.6 /100 | #134 | Excellent 5.1% |
| Immigrants | Latvia | 84.6 /100 | #135 | Excellent 5.1% |
| Indians (Asian) | 84.2 /100 | #136 | Excellent 5.1% |
| Pakistanis | 83.8 /100 | #137 | Excellent 5.1% |
| Chickasaw | 83.2 /100 | #138 | Excellent 5.1% |
| Immigrants | Eastern Asia | 83.0 /100 | #139 | Excellent 5.1% |
| Immigrants | France | 82.7 /100 | #140 | Excellent 5.1% |
| Immigrants | Eastern Europe | 81.5 /100 | #141 | Excellent 5.1% |
| Palestinians | 80.8 /100 | #142 | Excellent 5.1% |
| Immigrants | Kazakhstan | 80.7 /100 | #143 | Excellent 5.1% |