Cypriot vs Immigrants from Iran Male Unemployment
COMPARE
Cypriot
Immigrants from Iran
Male Unemployment
Male Unemployment Comparison
Cypriots
Immigrants from Iran
5.1%
MALE UNEMPLOYMENT
88.8/ 100
METRIC RATING
118th/ 347
METRIC RANK
5.3%
MALE UNEMPLOYMENT
50.0/ 100
METRIC RATING
174th/ 347
METRIC RANK
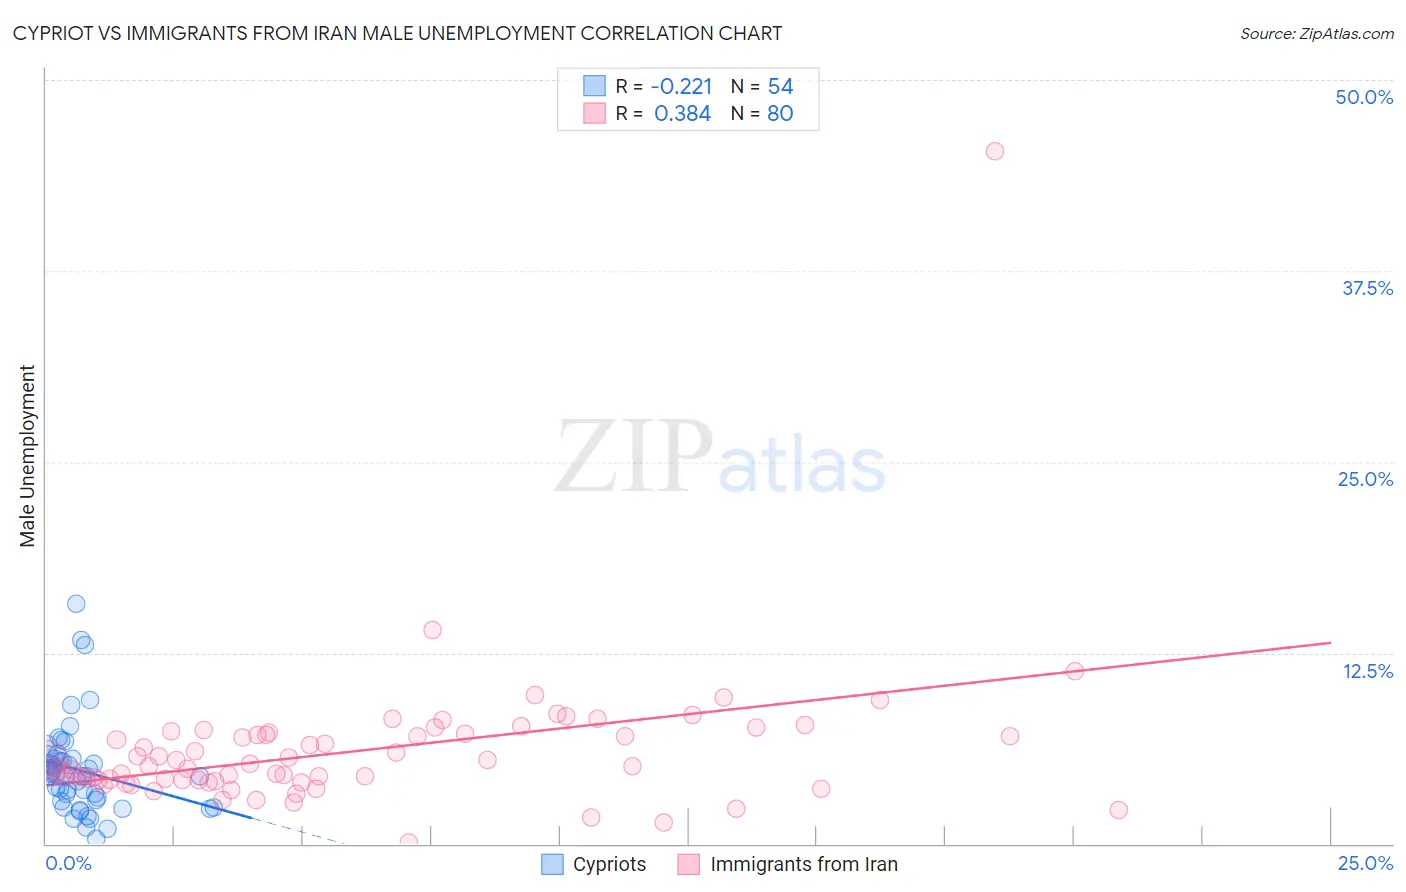
Cypriot vs Immigrants from Iran Male Unemployment Correlation Chart
The statistical analysis conducted on geographies consisting of 61,847,118 people shows a weak negative correlation between the proportion of Cypriots and unemployment rate among males in the United States with a correlation coefficient (R) of -0.221 and weighted average of 5.1%. Similarly, the statistical analysis conducted on geographies consisting of 279,526,020 people shows a mild positive correlation between the proportion of Immigrants from Iran and unemployment rate among males in the United States with a correlation coefficient (R) of 0.384 and weighted average of 5.3%, a difference of 3.1%.
Male Unemployment Correlation Summary
| Measurement | Cypriot | Immigrants from Iran |
| Minimum | 0.30% | 0.10% |
| Maximum | 15.7% | 45.3% |
| Range | 15.4% | 45.2% |
| Mean | 4.8% | 6.1% |
| Median | 4.5% | 5.1% |
| Interquartile 25% (IQ1) | 2.9% | 4.2% |
| Interquartile 75% (IQ3) | 5.6% | 7.2% |
| Interquartile Range (IQR) | 2.7% | 3.0% |
| Standard Deviation (Sample) | 3.0% | 5.0% |
| Standard Deviation (Population) | 2.9% | 5.0% |
Similar Demographics by Male Unemployment
Demographics Similar to Cypriots by Male Unemployment
In terms of male unemployment, the demographic groups most similar to Cypriots are Estonian (5.1%, a difference of 0.030%), French Canadian (5.1%, a difference of 0.040%), Ukrainian (5.1%, a difference of 0.060%), Mongolian (5.1%, a difference of 0.070%), and Immigrants from Denmark (5.1%, a difference of 0.080%).
| Demographics | Rating | Rank | Male Unemployment |
| Immigrants | Eastern Asia | 90.8 /100 | #111 | Exceptional 5.1% |
| Immigrants | Moldova | 90.3 /100 | #112 | Exceptional 5.1% |
| Immigrants | Austria | 90.3 /100 | #113 | Exceptional 5.1% |
| Romanians | 89.8 /100 | #114 | Excellent 5.1% |
| Immigrants | Asia | 89.6 /100 | #115 | Excellent 5.1% |
| Immigrants | Denmark | 89.4 /100 | #116 | Excellent 5.1% |
| Estonians | 89.0 /100 | #117 | Excellent 5.1% |
| Cypriots | 88.8 /100 | #118 | Excellent 5.1% |
| French Canadians | 88.6 /100 | #119 | Excellent 5.1% |
| Ukrainians | 88.4 /100 | #120 | Excellent 5.1% |
| Mongolians | 88.4 /100 | #121 | Excellent 5.1% |
| Nicaraguans | 88.2 /100 | #122 | Excellent 5.1% |
| Palestinians | 87.7 /100 | #123 | Excellent 5.1% |
| Immigrants | Latvia | 87.5 /100 | #124 | Excellent 5.1% |
| Immigrants | Lithuania | 87.2 /100 | #125 | Excellent 5.1% |
Demographics Similar to Immigrants from Iran by Male Unemployment
In terms of male unemployment, the demographic groups most similar to Immigrants from Iran are Immigrants from Russia (5.3%, a difference of 0.040%), Immigrants from Kazakhstan (5.3%, a difference of 0.050%), Peruvian (5.3%, a difference of 0.11%), Immigrants from Iraq (5.3%, a difference of 0.11%), and Immigrants from Poland (5.3%, a difference of 0.23%).
| Demographics | Rating | Rank | Male Unemployment |
| Immigrants | Vietnam | 58.1 /100 | #167 | Average 5.3% |
| Immigrants | Ireland | 57.7 /100 | #168 | Average 5.3% |
| Immigrants | Congo | 57.4 /100 | #169 | Average 5.3% |
| Immigrants | Eastern Europe | 54.1 /100 | #170 | Average 5.3% |
| Peruvians | 51.9 /100 | #171 | Average 5.3% |
| Immigrants | Kazakhstan | 50.8 /100 | #172 | Average 5.3% |
| Immigrants | Russia | 50.7 /100 | #173 | Average 5.3% |
| Immigrants | Iran | 50.0 /100 | #174 | Average 5.3% |
| Immigrants | Iraq | 48.1 /100 | #175 | Average 5.3% |
| Immigrants | Poland | 46.0 /100 | #176 | Average 5.3% |
| Immigrants | Peru | 44.6 /100 | #177 | Average 5.3% |
| Osage | 42.5 /100 | #178 | Average 5.3% |
| Immigrants | Oceania | 40.8 /100 | #179 | Average 5.3% |
| Malaysians | 39.6 /100 | #180 | Fair 5.3% |
| Immigrants | Afghanistan | 37.9 /100 | #181 | Fair 5.3% |