Cypriot vs Immigrants from Caribbean Male Unemployment
COMPARE
Cypriot
Immigrants from Caribbean
Male Unemployment
Male Unemployment Comparison
Cypriots
Immigrants from Caribbean
5.1%
MALE UNEMPLOYMENT
88.8/ 100
METRIC RATING
118th/ 347
METRIC RANK
6.3%
MALE UNEMPLOYMENT
0.0/ 100
METRIC RATING
289th/ 347
METRIC RANK
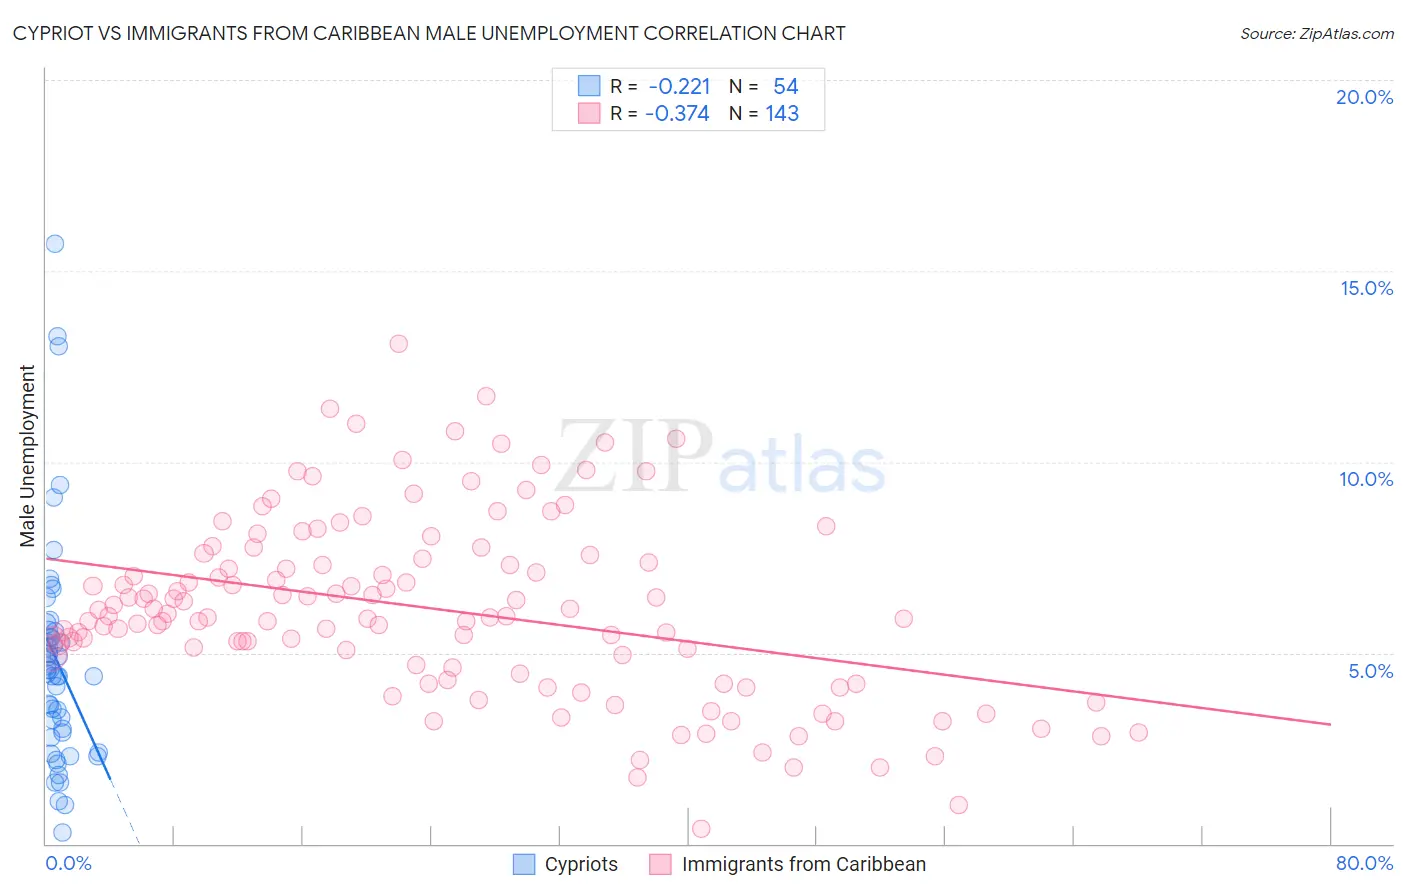
Cypriot vs Immigrants from Caribbean Male Unemployment Correlation Chart
The statistical analysis conducted on geographies consisting of 61,847,118 people shows a weak negative correlation between the proportion of Cypriots and unemployment rate among males in the United States with a correlation coefficient (R) of -0.221 and weighted average of 5.1%. Similarly, the statistical analysis conducted on geographies consisting of 447,554,684 people shows a mild negative correlation between the proportion of Immigrants from Caribbean and unemployment rate among males in the United States with a correlation coefficient (R) of -0.374 and weighted average of 6.3%, a difference of 22.4%.
Male Unemployment Correlation Summary
| Measurement | Cypriot | Immigrants from Caribbean |
| Minimum | 0.30% | 0.40% |
| Maximum | 15.7% | 13.1% |
| Range | 15.4% | 12.7% |
| Mean | 4.8% | 6.1% |
| Median | 4.5% | 6.0% |
| Interquartile 25% (IQ1) | 2.9% | 4.6% |
| Interquartile 75% (IQ3) | 5.6% | 7.5% |
| Interquartile Range (IQR) | 2.7% | 2.8% |
| Standard Deviation (Sample) | 3.0% | 2.4% |
| Standard Deviation (Population) | 2.9% | 2.3% |
Similar Demographics by Male Unemployment
Demographics Similar to Cypriots by Male Unemployment
In terms of male unemployment, the demographic groups most similar to Cypriots are Estonian (5.1%, a difference of 0.030%), French Canadian (5.1%, a difference of 0.040%), Ukrainian (5.1%, a difference of 0.060%), Mongolian (5.1%, a difference of 0.070%), and Immigrants from Denmark (5.1%, a difference of 0.080%).
| Demographics | Rating | Rank | Male Unemployment |
| Immigrants | Eastern Asia | 90.8 /100 | #111 | Exceptional 5.1% |
| Immigrants | Moldova | 90.3 /100 | #112 | Exceptional 5.1% |
| Immigrants | Austria | 90.3 /100 | #113 | Exceptional 5.1% |
| Romanians | 89.8 /100 | #114 | Excellent 5.1% |
| Immigrants | Asia | 89.6 /100 | #115 | Excellent 5.1% |
| Immigrants | Denmark | 89.4 /100 | #116 | Excellent 5.1% |
| Estonians | 89.0 /100 | #117 | Excellent 5.1% |
| Cypriots | 88.8 /100 | #118 | Excellent 5.1% |
| French Canadians | 88.6 /100 | #119 | Excellent 5.1% |
| Ukrainians | 88.4 /100 | #120 | Excellent 5.1% |
| Mongolians | 88.4 /100 | #121 | Excellent 5.1% |
| Nicaraguans | 88.2 /100 | #122 | Excellent 5.1% |
| Palestinians | 87.7 /100 | #123 | Excellent 5.1% |
| Immigrants | Latvia | 87.5 /100 | #124 | Excellent 5.1% |
| Immigrants | Lithuania | 87.2 /100 | #125 | Excellent 5.1% |
Demographics Similar to Immigrants from Caribbean by Male Unemployment
In terms of male unemployment, the demographic groups most similar to Immigrants from Caribbean are Immigrants from Senegal (6.3%, a difference of 0.12%), Central American Indian (6.3%, a difference of 0.16%), African (6.3%, a difference of 0.45%), Immigrants from Ecuador (6.2%, a difference of 0.88%), and Spanish American Indian (6.2%, a difference of 0.90%).
| Demographics | Rating | Rank | Male Unemployment |
| Ecuadorians | 0.0 /100 | #282 | Tragic 6.2% |
| Immigrants | Western Africa | 0.0 /100 | #283 | Tragic 6.2% |
| Spanish American Indians | 0.0 /100 | #284 | Tragic 6.2% |
| Immigrants | Ecuador | 0.0 /100 | #285 | Tragic 6.2% |
| Africans | 0.0 /100 | #286 | Tragic 6.3% |
| Central American Indians | 0.0 /100 | #287 | Tragic 6.3% |
| Immigrants | Senegal | 0.0 /100 | #288 | Tragic 6.3% |
| Immigrants | Caribbean | 0.0 /100 | #289 | Tragic 6.3% |
| U.S. Virgin Islanders | 0.0 /100 | #290 | Tragic 6.4% |
| Immigrants | Azores | 0.0 /100 | #291 | Tragic 6.4% |
| Nepalese | 0.0 /100 | #292 | Tragic 6.4% |
| Haitians | 0.0 /100 | #293 | Tragic 6.4% |
| Senegalese | 0.0 /100 | #294 | Tragic 6.4% |
| Belizeans | 0.0 /100 | #295 | Tragic 6.5% |
| Immigrants | Haiti | 0.0 /100 | #296 | Tragic 6.5% |