Kenyan vs Immigrants from Iran Male Unemployment
COMPARE
Kenyan
Immigrants from Iran
Male Unemployment
Male Unemployment Comparison
Kenyans
Immigrants from Iran
5.2%
MALE UNEMPLOYMENT
79.4/ 100
METRIC RATING
139th/ 347
METRIC RANK
5.3%
MALE UNEMPLOYMENT
50.0/ 100
METRIC RATING
174th/ 347
METRIC RANK
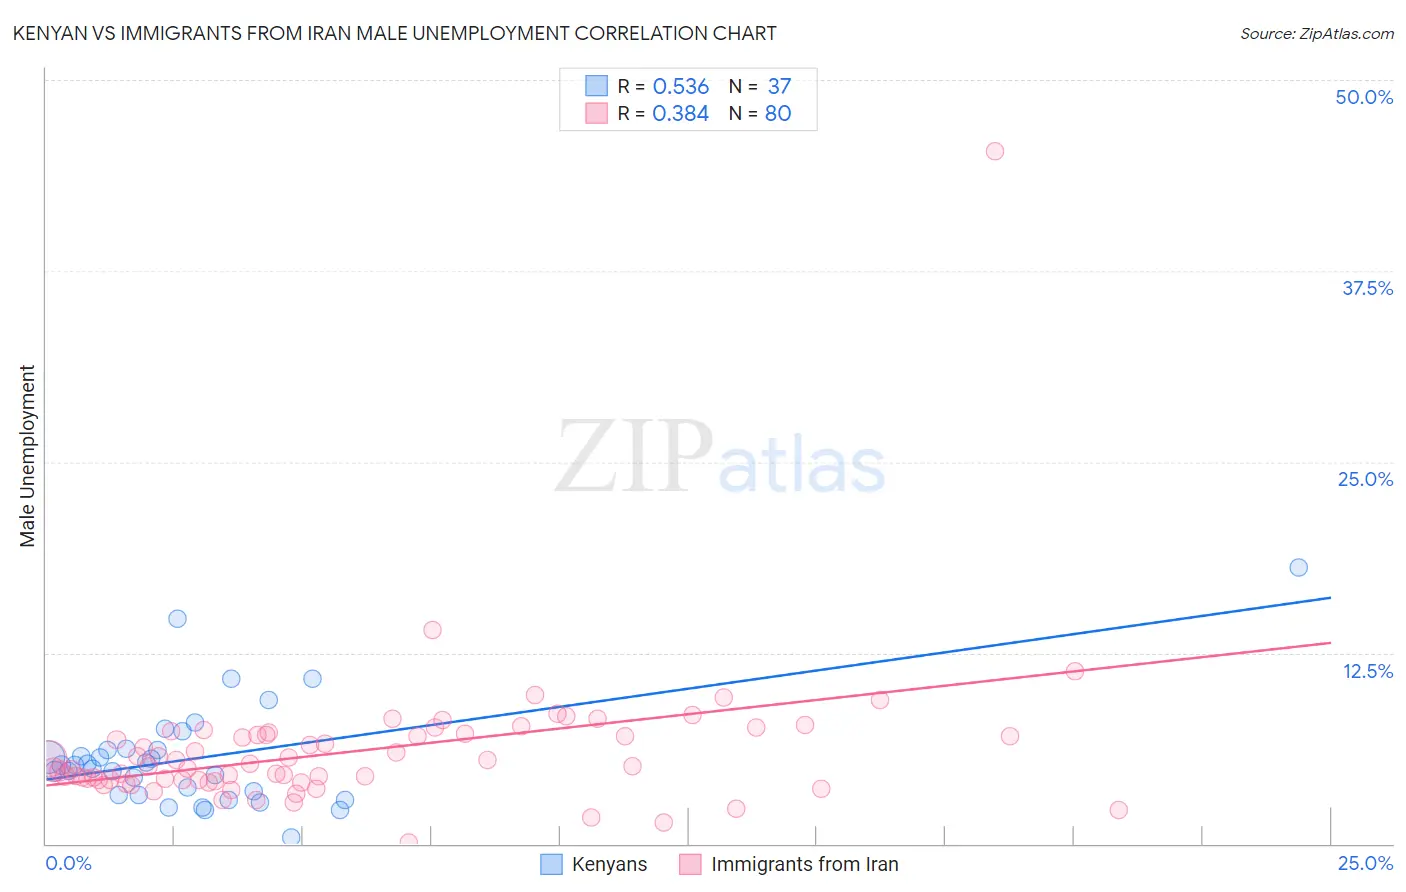
Kenyan vs Immigrants from Iran Male Unemployment Correlation Chart
The statistical analysis conducted on geographies consisting of 168,001,564 people shows a substantial positive correlation between the proportion of Kenyans and unemployment rate among males in the United States with a correlation coefficient (R) of 0.536 and weighted average of 5.2%. Similarly, the statistical analysis conducted on geographies consisting of 279,526,020 people shows a mild positive correlation between the proportion of Immigrants from Iran and unemployment rate among males in the United States with a correlation coefficient (R) of 0.384 and weighted average of 5.3%, a difference of 2.0%.
Male Unemployment Correlation Summary
| Measurement | Kenyan | Immigrants from Iran |
| Minimum | 0.40% | 0.10% |
| Maximum | 18.1% | 45.3% |
| Range | 17.7% | 45.2% |
| Mean | 5.6% | 6.1% |
| Median | 5.1% | 5.1% |
| Interquartile 25% (IQ1) | 3.2% | 4.2% |
| Interquartile 75% (IQ3) | 6.2% | 7.2% |
| Interquartile Range (IQR) | 3.0% | 3.0% |
| Standard Deviation (Sample) | 3.5% | 5.0% |
| Standard Deviation (Population) | 3.5% | 5.0% |
Similar Demographics by Male Unemployment
Demographics Similar to Kenyans by Male Unemployment
In terms of male unemployment, the demographic groups most similar to Kenyans are Brazilian (5.2%, a difference of 0.010%), Immigrants from Croatia (5.2%, a difference of 0.020%), Immigrants from Switzerland (5.2%, a difference of 0.020%), Immigrants from Eastern Africa (5.2%, a difference of 0.030%), and Lebanese (5.2%, a difference of 0.040%).
| Demographics | Rating | Rank | Male Unemployment |
| Chickasaw | 82.9 /100 | #132 | Excellent 5.2% |
| Colombians | 81.1 /100 | #133 | Excellent 5.2% |
| Pakistanis | 80.5 /100 | #134 | Excellent 5.2% |
| Immigrants | Saudi Arabia | 80.1 /100 | #135 | Excellent 5.2% |
| Lebanese | 79.9 /100 | #136 | Good 5.2% |
| Immigrants | Eastern Africa | 79.8 /100 | #137 | Good 5.2% |
| Immigrants | Croatia | 79.7 /100 | #138 | Good 5.2% |
| Kenyans | 79.4 /100 | #139 | Good 5.2% |
| Brazilians | 79.3 /100 | #140 | Good 5.2% |
| Immigrants | Switzerland | 79.2 /100 | #141 | Good 5.2% |
| Fijians | 78.3 /100 | #142 | Good 5.2% |
| Syrians | 78.0 /100 | #143 | Good 5.2% |
| Sri Lankans | 77.9 /100 | #144 | Good 5.2% |
| Macedonians | 77.7 /100 | #145 | Good 5.2% |
| Immigrants | Kenya | 77.6 /100 | #146 | Good 5.2% |
Demographics Similar to Immigrants from Iran by Male Unemployment
In terms of male unemployment, the demographic groups most similar to Immigrants from Iran are Immigrants from Russia (5.3%, a difference of 0.040%), Immigrants from Kazakhstan (5.3%, a difference of 0.050%), Peruvian (5.3%, a difference of 0.11%), Immigrants from Iraq (5.3%, a difference of 0.11%), and Immigrants from Poland (5.3%, a difference of 0.23%).
| Demographics | Rating | Rank | Male Unemployment |
| Immigrants | Vietnam | 58.1 /100 | #167 | Average 5.3% |
| Immigrants | Ireland | 57.7 /100 | #168 | Average 5.3% |
| Immigrants | Congo | 57.4 /100 | #169 | Average 5.3% |
| Immigrants | Eastern Europe | 54.1 /100 | #170 | Average 5.3% |
| Peruvians | 51.9 /100 | #171 | Average 5.3% |
| Immigrants | Kazakhstan | 50.8 /100 | #172 | Average 5.3% |
| Immigrants | Russia | 50.7 /100 | #173 | Average 5.3% |
| Immigrants | Iran | 50.0 /100 | #174 | Average 5.3% |
| Immigrants | Iraq | 48.1 /100 | #175 | Average 5.3% |
| Immigrants | Poland | 46.0 /100 | #176 | Average 5.3% |
| Immigrants | Peru | 44.6 /100 | #177 | Average 5.3% |
| Osage | 42.5 /100 | #178 | Average 5.3% |
| Immigrants | Oceania | 40.8 /100 | #179 | Average 5.3% |
| Malaysians | 39.6 /100 | #180 | Fair 5.3% |
| Immigrants | Afghanistan | 37.9 /100 | #181 | Fair 5.3% |