Spanish vs Immigrants from Iran Male Unemployment
COMPARE
Spanish
Immigrants from Iran
Male Unemployment
Male Unemployment Comparison
Spanish
Immigrants from Iran
5.4%
MALE UNEMPLOYMENT
19.7/ 100
METRIC RATING
194th/ 347
METRIC RANK
5.3%
MALE UNEMPLOYMENT
50.0/ 100
METRIC RATING
174th/ 347
METRIC RANK
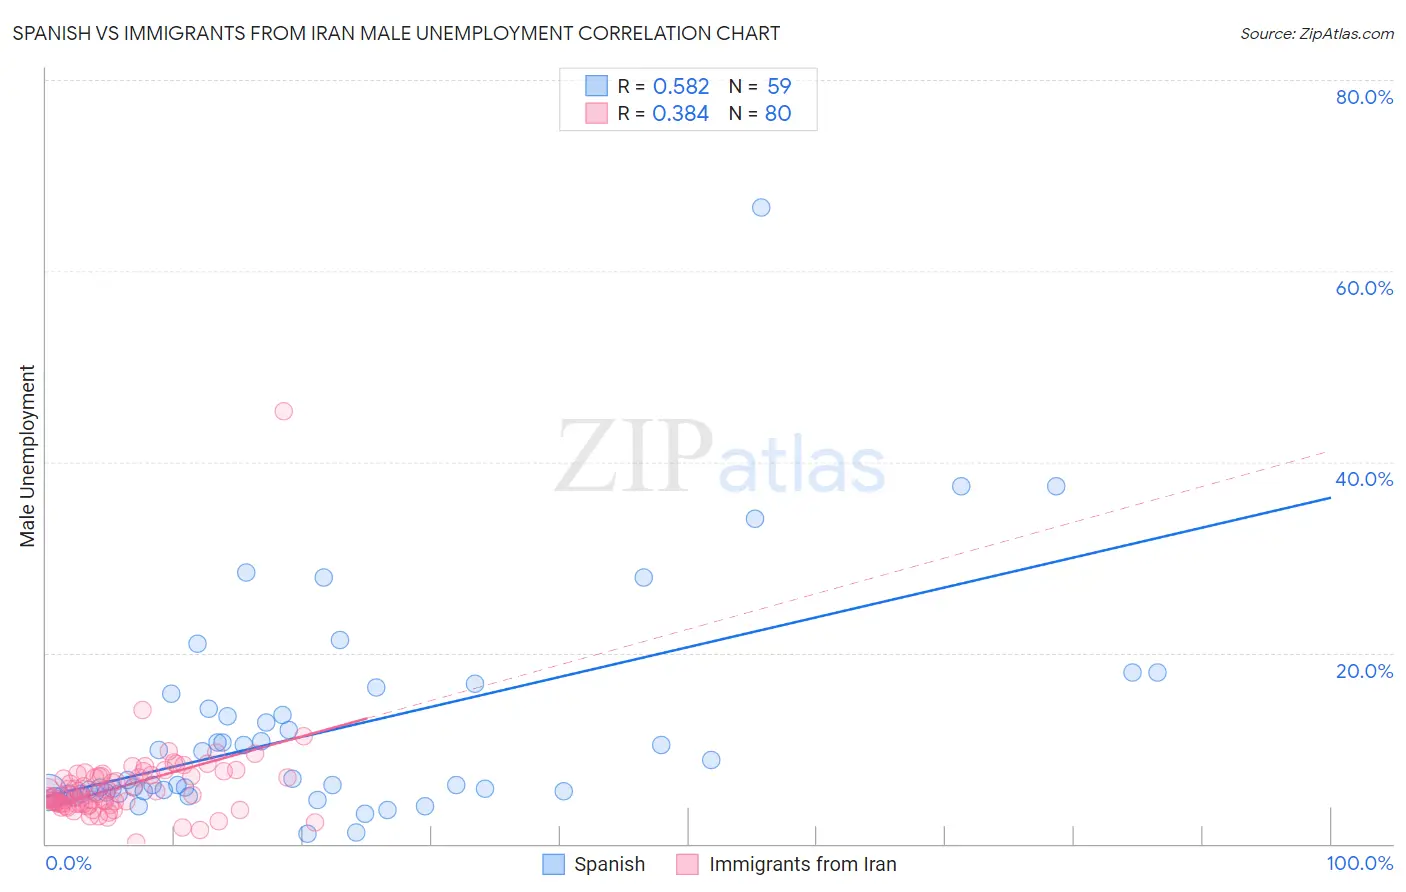
Spanish vs Immigrants from Iran Male Unemployment Correlation Chart
The statistical analysis conducted on geographies consisting of 419,777,027 people shows a substantial positive correlation between the proportion of Spanish and unemployment rate among males in the United States with a correlation coefficient (R) of 0.582 and weighted average of 5.4%. Similarly, the statistical analysis conducted on geographies consisting of 279,526,020 people shows a mild positive correlation between the proportion of Immigrants from Iran and unemployment rate among males in the United States with a correlation coefficient (R) of 0.384 and weighted average of 5.3%, a difference of 2.1%.
Male Unemployment Correlation Summary
| Measurement | Spanish | Immigrants from Iran |
| Minimum | 1.1% | 0.10% |
| Maximum | 66.7% | 45.3% |
| Range | 65.6% | 45.2% |
| Mean | 11.8% | 6.1% |
| Median | 6.2% | 5.1% |
| Interquartile 25% (IQ1) | 5.3% | 4.2% |
| Interquartile 75% (IQ3) | 14.1% | 7.2% |
| Interquartile Range (IQR) | 8.8% | 3.0% |
| Standard Deviation (Sample) | 11.4% | 5.0% |
| Standard Deviation (Population) | 11.3% | 5.0% |
Demographics Similar to Spanish and Immigrants from Iran by Male Unemployment
In terms of male unemployment, the demographic groups most similar to Spanish are Immigrants from Israel (5.4%, a difference of 0.46%), Immigrants from Belarus (5.4%, a difference of 0.52%), Immigrants from South Eastern Asia (5.4%, a difference of 0.68%), Immigrants from Uganda (5.4%, a difference of 0.72%), and Immigrants from South America (5.4%, a difference of 0.76%). Similarly, the demographic groups most similar to Immigrants from Iran are Immigrants from Iraq (5.3%, a difference of 0.11%), Immigrants from Poland (5.3%, a difference of 0.23%), Immigrants from Peru (5.3%, a difference of 0.31%), Osage (5.3%, a difference of 0.44%), and Immigrants from Oceania (5.3%, a difference of 0.54%).
| Demographics | Rating | Rank | Male Unemployment |
| Immigrants | Iran | 50.0 /100 | #174 | Average 5.3% |
| Immigrants | Iraq | 48.1 /100 | #175 | Average 5.3% |
| Immigrants | Poland | 46.0 /100 | #176 | Average 5.3% |
| Immigrants | Peru | 44.6 /100 | #177 | Average 5.3% |
| Osage | 42.5 /100 | #178 | Average 5.3% |
| Immigrants | Oceania | 40.8 /100 | #179 | Average 5.3% |
| Malaysians | 39.6 /100 | #180 | Fair 5.3% |
| Immigrants | Afghanistan | 37.9 /100 | #181 | Fair 5.3% |
| Potawatomi | 37.8 /100 | #182 | Fair 5.3% |
| Taiwanese | 37.6 /100 | #183 | Fair 5.3% |
| Spaniards | 35.1 /100 | #184 | Fair 5.3% |
| Koreans | 34.9 /100 | #185 | Fair 5.3% |
| Iraqis | 31.6 /100 | #186 | Fair 5.4% |
| Costa Ricans | 31.3 /100 | #187 | Fair 5.4% |
| Arabs | 30.2 /100 | #188 | Fair 5.4% |
| Immigrants | South America | 29.4 /100 | #189 | Fair 5.4% |
| Immigrants | Uganda | 28.8 /100 | #190 | Fair 5.4% |
| Immigrants | South Eastern Asia | 28.2 /100 | #191 | Fair 5.4% |
| Immigrants | Belarus | 26.0 /100 | #192 | Fair 5.4% |
| Immigrants | Israel | 25.2 /100 | #193 | Fair 5.4% |
| Spanish | 19.7 /100 | #194 | Poor 5.4% |